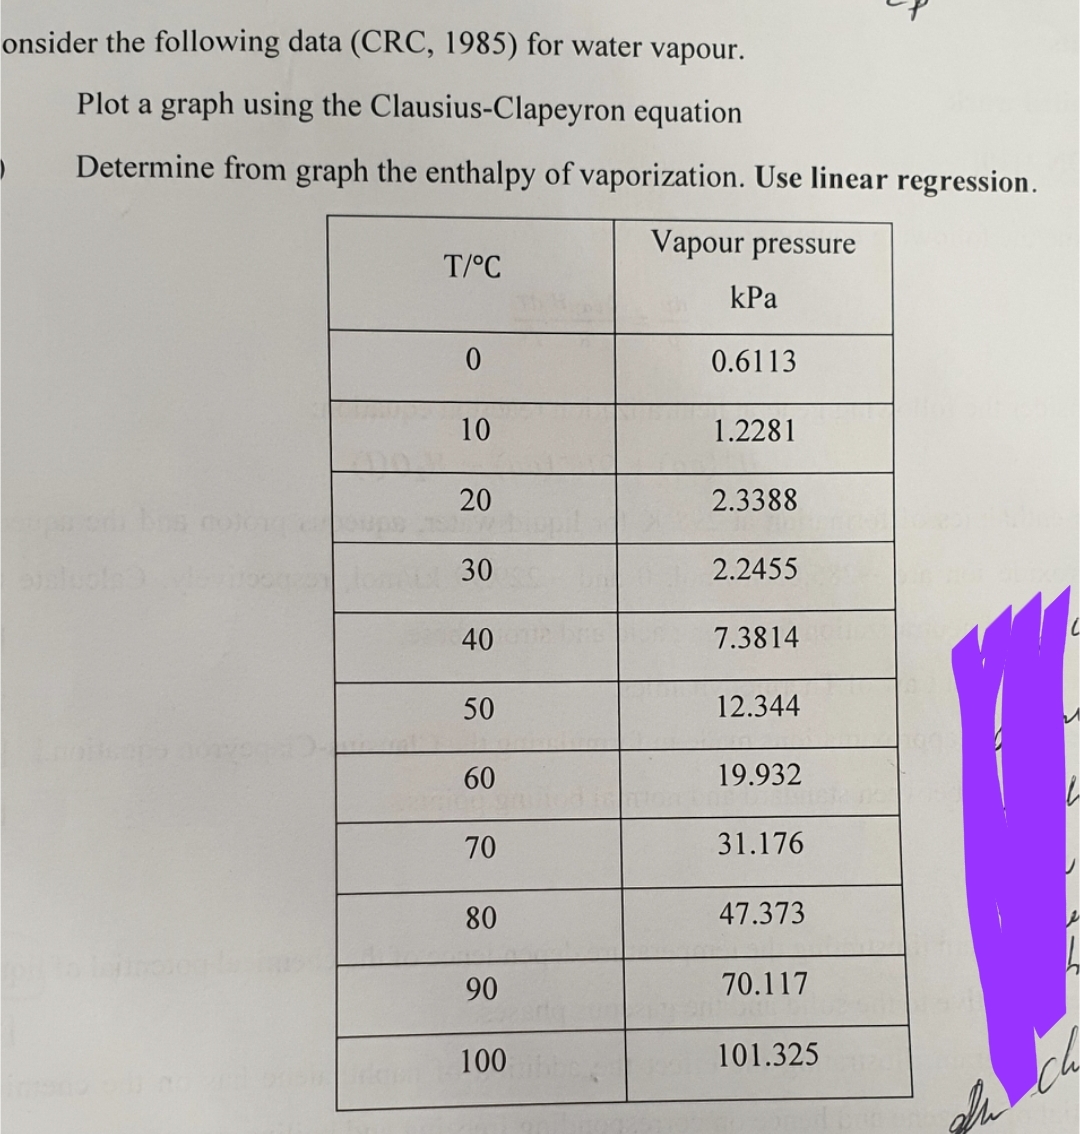
-nsider the following data (CRC, 1985) for water vapour. Plot a graph using the Clausius-Clapeyron equation Determine from graph the enthalpy of vaporization. Use linear regression. Vapour pressure T/°C 0 10 20 30 40 50 60 70 80 90 100 kPa 0.6113 1.2281 2.3388 2.2455 7.3814 12.344 19.932 31.176 47.373 70.117 101.325
-nsider the following data (CRC, 1985) for water vapour. Plot a graph using the Clausius-Clapeyron equation Determine from graph the enthalpy of vaporization. Use linear regression. Vapour pressure T/°C 0 10 20 30 40 50 60 70 80 90 100 kPa 0.6113 1.2281 2.3388 2.2455 7.3814 12.344 19.932 31.176 47.373 70.117 101.325

Physical Chemistry
2nd Edition
ISBN:9781133958437
Author:Ball, David W. (david Warren), BAER, Tomas
Publisher:Ball, David W. (david Warren), BAER, Tomas
Chapter6: Equilibria In Single-component Systems
Section: Chapter Questions
Problem 6.50E

Related questions
Question
Transcribed Image Text:onsider the following data (CRC, 1985) for water vapour.
Plot a graph using the Clausius-Clapeyron equation
Determine from graph the enthalpy of vaporization. Use linear regression.
Vapour pressure
bus colo
T/°C
0
10
20
30
40
50
60
70
80
90
100
kPa
0.6113
1.2281
2.3388
2.2455
7.3814
12.344
19.932
31.176
47.373
70.117
101.325
l
Expert Solution
This question has been solved!
Explore an expertly crafted, step-by-step solution for a thorough understanding of key concepts.

Step by step
Solved in 5 steps with 1 images

Knowledge Booster


Learn more about
Need a deep-dive on the concept behind this application? Look no further. Learn more about this topic, chemistry and related others by exploring similar questions and additional content below.Recommended textbooks for you
Physical Chemistry
Chemistry
ISBN:
9781133958437
Author:
Ball, David W. (david Warren), BAER, Tomas
Publisher:
Wadsworth Cengage Learning,
Physical Chemistry
Chemistry
ISBN:
9781133958437
Author:
Ball, David W. (david Warren), BAER, Tomas
Publisher:
Wadsworth Cengage Learning,