
Related questions
Excel output:
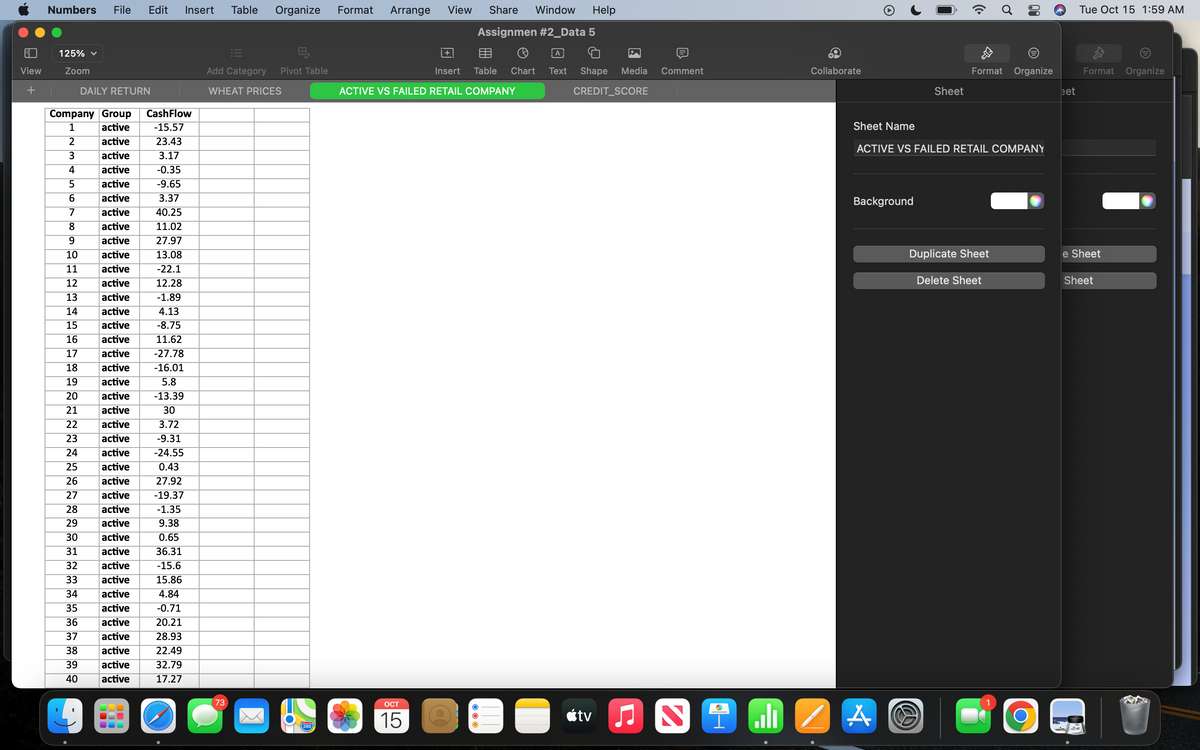
In what ways are companies that fail different from those that continue to do business? To answer this question, one study compared various characteristics of active and failed retail firms. One of the variables was the cash flow margin. Roughly speaking, this is a measure of how efficiently a company converts its sales dollars to cash and is a key profitability measure. The higher the percentage, the more profitable the company.
The data for 40 companies is given in Excel under ACTIVE VERSUS FAILED RETAIL COMPANIES sheet.
You will compare the mean cash flow margin for the two groups of firms using a significance test. The question of interest is whether the mean cash flow margin is different for the two groups.
We assume that the population variances are equal and α = 0.01 for significance test.
a) Write out the null and alternative hypothesis associated with the research question. (Note: is this a one or two tailed test?)
b) What type of statistical test will you use to answer the proposed research question? (Note: Is this a z-test or a t-test?
c) What critical value is associated with the 0.01 level of significance? Be sure and include whether this critical value is a z or t value and, if appropriate, include the degrees of freedom associated with this statistical test.
d) What is the calculated value of the test statistic?
e) What decision should be made regarding the null hypothesis?
f. Provide a brief conclusion regarding your findings. Use your PowerPoint lecture slides for writing out the interpretation of your results. (5 p)

to generate a solution
a solution

- The worksheet shown in the figure below contains two years of sales that will be used to create a PivotChart. The goal is to create a column chart that shows the total sales dollars by year for each month. Given this goal, what would be the best chart area to place the Year field? 1 2 3 4 3 6 7 . 9 10 11 12 13 14 15 Year Month 2017 April 2018 April 2017 August 2018 August 2017 December 2018 December 2017 February 2018 February 2017 January 2018 January 2017 July 2018 July 2017 June 2018 June VALUES O LEGEND AXIS FILTERS Total Sales Dollars $ 50,970.00 $ 48,400.00 $ 52,470.00 $ 50,700.00 $112,425.00 $120,000.00 $ 56,205.00 $ 56,850.00 $ 59,940,00 $ 62,950.00 $19.980.00 $ 18,500.00 $ 22.485.00 $ 21,000.00arrow_forward1. There is 250,000 dollars that you have to divide to x amount of students in a year. Based on quality and quantity. How would decided this amount of dollars in an excel sheet that Is based on the amount of times the amount of lessons they complete. Also based on the rating the receive from a 1-5. 1 being the least amount of money and 5 being the most amount of money. How do you represent this ?arrow_forwardDo you run your own business or have access to business data? If yes let’s brainstorm about data you would want to collect. Store daily sales in a table like below. Observation Date Sales In Dollars 1 6/30/2021 2512.30 2 7/1/2021 2945.12 Etc. This works if you are selling a single product, or if you want to aggregate all products into one. Aggregation is useful in analysis, but personally I believe it is better to gather data at its lowest form and then aggregate. Suppose you are doing analysis for a simple bakery. By simple I mean a small menu of items, see the table below. Product Acronym Large Loaf (Swiss bread 2 lb. loaf) LL Small Loaf (Swiss bread 1 lb. loaf) SL Banana Bread BB Banana Nut Bread BNB Oatmeal raisin Cookies (1 dozen) OR Chocolate Chip Cookies (1 dozen) CCC Cinnamon Roll (each) CR Relevant information, to start, would include. Product sold (prod), price of the product (p), quantity…arrow_forward
- You are building a classification model to predict whether a firm will go bankrupt within the next 5 years. When you collect the data, you find that the number of instances of firms that went bankrupt is smaller than the number of cases of firms that did not go bankrupt. Specifically, only 7% of the firms went bankrupt, while the rest did not go bankrupt. Once you build the classification model, you need to compare performance against a baseline. Which of the following would be an appropriate baseline? O Always predicting that the firm does not go bankrupt O Making a prediction that a firm goes bankrupt with 7% probability O Always predicting that the firm goes bankrupt Making a prediction from the set (bankrupt, not bankrupt) with equal probabilityarrow_forwardThe DBMS's query optimisation processes reduce the workload of the DBA.arrow_forwardBelow is a set of data containing information about a pizza shop. The data table contains the day data was collected, the amount of customers that bought pizzas that day, and the average amount of pizzas each customer bought. Amount of Customers Average Volume Bought Day Monday Tuesday Wednesday Thursday Friday 15 4 12 17 10 3 25 7 What Excel function would help figure out how many pizzas were bought in total the week this data was collected? [Spreadsheet Modeling] O COUNTIF O IF O SUMPRODUCT O SUMarrow_forward
- I would like to include the number of sales representatives and sales assistens in my sales process as a factor that influences revenue. How can I do that?arrow_forwardThe mayor of a city is interested in learning what goals are most important for residents of the city. Members of her staff visit one of the many neighborhoods in the city and ask 20 residents to fill out a survey. The mayor is concerned that the survey may be biased and not accurately reflect the overall interests in her town. Which of the following strategies is MOST likely to address concerns about the data being biased or inaccurate. a Finding the same people surveyed previously to ask more detailed questions. b Visiting the same neighborhood to collect more survey responses. c Visiting multiple new neighborhoods to collect more survey responses. d Having her staff collect the data using an app rather than paper surveys.arrow_forward
- Database System ConceptsComputer ScienceISBN:9780078022159Author:Abraham Silberschatz Professor, Henry F. Korth, S. SudarshanPublisher:McGraw-Hill Education
 Starting Out with Python (4th Edition)Computer ScienceISBN:9780134444321Author:Tony GaddisPublisher:PEARSON
 Digital Fundamentals (11th Edition)Computer ScienceISBN:9780132737968Author:Thomas L. FloydPublisher:PEARSON
  C How to Program (8th Edition)Computer ScienceISBN:9780133976892Author:Paul J. Deitel, Harvey DeitelPublisher:PEARSON
 Database Systems: Design, Implementation, & Manag...Computer ScienceISBN:9781337627900Author:Carlos Coronel, Steven MorrisPublisher:Cengage Learning
 Programmable Logic ControllersComputer ScienceISBN:9780073373843Author:Frank D. PetruzellaPublisher:McGraw-Hill Education