Obstetrics The figure below plots the sampling distribution of the mean from 200 samples of size 8 from the population of 1,000 birthweights. The mean of the 1,000 birthweights is 112.0 oz with standard deviation 20.6 oz. The data are available in SALT. 17 16 15 13 12 100 110 130 120 Birthweight (b) in oz D USE SALT (a) If the central-limit theorem holds, what proportion of the sample means should fall within 0.5 lb of the population mean (112.0 oz)? (Round your answer to four decimal places.) X (b) If the central-limit theorem holds, what proportion of the sample means should fall within 1 lb of the population mean (112.0 oz)? (Round your answer to four decimal places.) x % of samples with birthweight = b
Obstetrics The figure below plots the sampling distribution of the mean from 200 samples of size 8 from the population of 1,000 birthweights. The mean of the 1,000 birthweights is 112.0 oz with standard deviation 20.6 oz. The data are available in SALT. 17 16 15 13 12 100 110 130 120 Birthweight (b) in oz D USE SALT (a) If the central-limit theorem holds, what proportion of the sample means should fall within 0.5 lb of the population mean (112.0 oz)? (Round your answer to four decimal places.) X (b) If the central-limit theorem holds, what proportion of the sample means should fall within 1 lb of the population mean (112.0 oz)? (Round your answer to four decimal places.) x % of samples with birthweight = b

MATLAB: An Introduction with Applications
6th Edition
ISBN:9781119256830
Author:Amos Gilat
Publisher:Amos Gilat
Chapter1: Starting With Matlab
Section: Chapter Questions
Problem 1P

Related questions
Question
I need Parts A and B here. The answers should be close to the values in part C respectively, if it helps.
Transcribed Image Text:Obstetrics
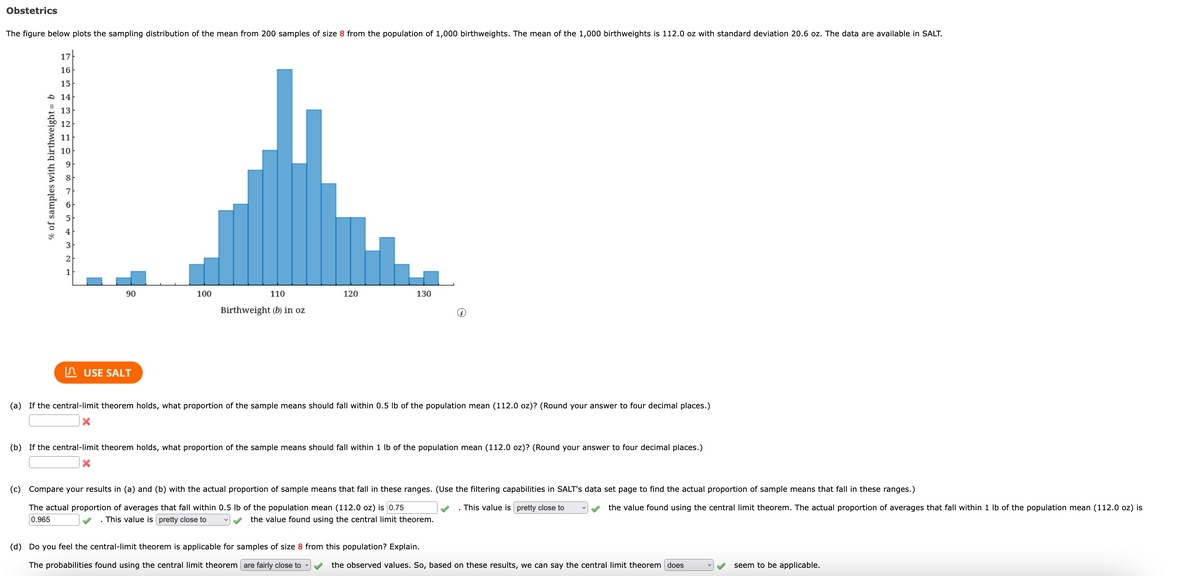
The figure below plots the sampling distribution of the mean from 200 samples of size 8 from the population of 1,000 birthweights. The mean of the 1,000 birthweights is 112.0 oz with standard deviation 20.6 oz. The data are available in SALT.
17
16
15
90
120
130
100
110
Birthweight (b) in oz
USE SALT
(a) If the central-limit theorem holds, what proportion of the sample means should fall within 0.5 lb of the population mean (112.0 oz)? (Round your answer to four decimal places.)
X
(b) If the central-limit theorem holds, what proportion of the sample means should fall within 1 lb of the population mean (112.0 oz)? (Round your answer to four decimal places.)
X
(c) Compare your results in (a) and (b) with the actual proportion of sample means that fall in these ranges. (Use the filtering capabilities in SALT's data set page to find the actual proportion of sample means that fall in these ranges.)
The actual proportion of averages that fall within 0.5 lb of the population mean (112.0 oz) is 0.75
. This value is pretty close to
the value found using the central limit theorem. The actual proportion of averages that fall within 1 lb of the population mean (112.0 oz) is
0.965
This value is pretty close to
the value found using the central limit theorem.
(d) Do you feel the central-limit theorem is applicable for samples of size 8 from this population? Explain.
The probabilities found using the central limit theorem are fairly close to
the observed values. So, based on these results, we can say the central limit theorem does
seem to be applicable.
% of samples with birthweight = b
14
13
12
11
10
9
3
2
1
Expert Solution
This question has been solved!
Explore an expertly crafted, step-by-step solution for a thorough understanding of key concepts.

This is a popular solution!

Trending now
This is a popular solution!

Step by step
Solved in 3 steps with 3 images

Recommended textbooks for you
MATLAB: An Introduction with Applications
Statistics
ISBN:
9781119256830
Author:
Amos Gilat
Publisher:
John Wiley & Sons Inc

Probability and Statistics for Engineering and th…
Statistics
ISBN:
9781305251809
Author:
Jay L. Devore
Publisher:
Cengage Learning

Statistics for The Behavioral Sciences (MindTap C…
Statistics
ISBN:
9781305504912
Author:
Frederick J Gravetter, Larry B. Wallnau
Publisher:
Cengage Learning
MATLAB: An Introduction with Applications
Statistics
ISBN:
9781119256830
Author:
Amos Gilat
Publisher:
John Wiley & Sons Inc
Probability and Statistics for Engineering and th…
Statistics
ISBN:
9781305251809
Author:
Jay L. Devore
Publisher:
Cengage Learning
Statistics for The Behavioral Sciences (MindTap C…
Statistics
ISBN:
9781305504912
Author:
Frederick J Gravetter, Larry B. Wallnau
Publisher:
Cengage Learning

Elementary Statistics: Picturing the World (7th E…
Statistics
ISBN:
9780134683416
Author:
Ron Larson, Betsy Farber
Publisher:
PEARSON

The Basic Practice of Statistics
Statistics
ISBN:
9781319042578
Author:
David S. Moore, William I. Notz, Michael A. Fligner
Publisher:
W. H. Freeman

Introduction to the Practice of Statistics
Statistics
ISBN:
9781319013387
Author:
David S. Moore, George P. McCabe, Bruce A. Craig
Publisher:
W. H. Freeman