
Database System Concepts
7th Edition
ISBN: 9780078022159
Author: Abraham Silberschatz Professor, Henry F. Korth, S. Sudarshan
Publisher: McGraw-Hill Education
expand_more
expand_more
format_list_bulleted
Related questions
Question
TODO 1: Using the Matplotlib plt.plot() function, plot the x values and y values. As seen in the illustration, a normal distribution should be drawn!
# TODO 1
plots = plt.plot(x_values, y_values)
Expected Output:
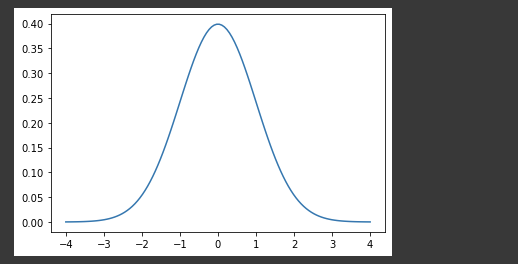

Transcribed Image Text:The image showcases a graph of a normal distribution, also known as a Gaussian distribution. The curve is symmetric and bell-shaped, centered around the mean, which in this case is zero.
Key details of the graph:
- **X-axis (Horizontal):** Represents the standardized values or z-scores, ranging from -4 to 4.
- **Y-axis (Vertical):** Displays the probability density, ranging from 0.00 to 0.40.
- **Curve**: The peak of the graph occurs at the mean (0), indicating the highest probability density. As the curve moves away from the mean, it gradually approaches zero, illustrating the properties of the normal distribution where values far from the mean are less probable.
This graph is an essential concept in statistics, emphasizing the significance of normal distribution in various fields such as psychology, finance, and natural sciences.
Expert Solution
This question has been solved!
Explore an expertly crafted, step-by-step solution for a thorough understanding of key concepts.

Step by stepSolved in 2 steps

Knowledge Booster


Learn more about
Need a deep-dive on the concept behind this application? Look no further. Learn more about this topic, computer-science and related others by exploring similar questions and additional content below.Similar questions
- Every time you see code like this: if (ptr->data) You should ask yourself if ptr could be null. Group of answer choices A. True B. Falsearrow_forwardImplement the Function has_error Implement the function according to the specification. Use the test script testcurrency.py to aid your development before checking your answer below. CANNOT USE IF/CONDITIONAL STATEMENTS Instead, you should use what you know about boolean expressions def has_error(json):"""Returns True if the response to a currency query encountered an error. Given a JSON string provided by the web service, this function returns True if thequery failed and there is an error message. For example, if the json is '{"success":false,"src":"","dst":"","error":"Source currency code is invalid."}' then this function returns True (It does NOT return the error message'Source currency code is invalid'). On the other hand if the json is '{"success": true, "src": "2 United States Dollars", "dst": "1.772814 Euros", "error": ""}' then this function returns False. The web server does NOT specify the number of spaces after the colons. The JSON '{"success":true, "src":"2 United…arrow_forwardQ3: Write a matlab program call matq3.m that returns the plot of the 2- D space defined by the following equation: (-xsin(x) cos (x) - 2π ≤ x < 0 x ≥ 2π Label the x-axis and y-axis and z-axis and title to the curve. y =arrow_forward
- Options are : F A D X C,E Barrow_forwardWrite T if the sentence is right; write F else, and fix the incorrect one. You need only respond to 5 of the following questions.The get() function may be used to append a new plot to an existing one.arrow_forwardCompute and Plot the ROC Curve Write a function from scratch called roc_curve_computer that accepts (in this exact order): a list of true labels a list of prediction probabilities (notice these are probabilities and not predictions - you will need to obtain the predictions from these probabilities) a list of threshold values. The function must compute and return the True Positive Rate (TPR, also called recall) and the False Positive Rate (FPR) for each threshold value in the threshold value list that is passed to the function. Important: Be sure to reuse functions and code segments from your work above! You should reuse two of your above created functions so that you do not duplicate your code. The function you will write behaves identically to Scikit-Learn's roc_curve function, except that it will take the list of thresholds in as input rather than return them as output. Your function must calculate one value of TPR and one value of FPR for each of the threshold values in the list.…arrow_forward
- Write a function that returns the greatest common divisor of 2 integers.arrow_forwardComplete the rotate_text() function that takes 2 parameters, a string data and an integer n. If n is positive, then the function will shift all the characters in data forward by n positions, with characters at the end of the string being moved to the start of the string. If n is 0 then the text remains the same. For example: rotate_text('abcde', rotate_text('abcde', rotate_text('abcde', 1) would return the string 'eabcd' 3) would return the string 'cdeab' 5) would return the string 'abcde' rotate_text('abcde', 6) would return the string 'eabcd' ... and so on. If n is negative, then the function will shift the characters in data backward by n positions, with characters at the start of the string being moved to the end of the string. For example: rotate text('abcde', -1) would return the string 'bcdea'arrow_forwardProblem Statement: In tennis, a set is finished when one of the players wins 6 games and the other one wins less than 5, or, if both players win at least 5 games, until one of the players wins 7 games. Determine if it is possible for a tennis set to be finished with the score score1: score2. Sample Output: 1. Input: score1: 3 score2: 6 Expected Output: true 2. Input: score1: 8 score2: 5 Expected Output: false 3. Input: score1: 6 score2: 5 Expected Output: falsearrow_forward
- Estimated Completion Time: 1 minute Given the following function header: def longest_chain(1st: list[int]) -> int: Given a list of integers, return the length of the longest chain of 1's that start from the beginning. Precondition: 1st is non-empty which one of the cases below is the least useful to check? Select the best answer. O longest_chain([0]) O longest_chain([0) O longest_chain([1, 1, 0]) O longest_chain([1, 1, 0, 1) O longest_chain([1, 0, 1, 1))arrow_forwardWhich of the following is are the correct syntax of specifying choices for a random function 1) random.choice(2,3,4) 2) random.choice([2,3,4]) 3) random.choice((2,3,4)) a) None b) 1.2, 3 are correctarrow_forwardInstructions There are four clubs in Tesset University South, North, West, and East. A Tesset student can choose to join any number of clubs. Your task is to determine how many students are enrolled in exactly two clubs. Write a function/method named dualClubCounter that will accept a string containing the student number and his desired club. Return a set containing the name of students are enrolled exactly in two clubs. Use SET in your solution Example #1 INPUT: "12300:East,12301:West, 12302:South, 12300:West, 123 Expected Content of Set = [12300] Example #2 INPUT: "12300:East,12301:West, 12302:South, 12300:West,123 Expected Content of Set = [12300, 12301]arrow_forward
arrow_back_ios
SEE MORE QUESTIONS
arrow_forward_ios
Recommended textbooks for you
- Database System ConceptsComputer ScienceISBN:9780078022159Author:Abraham Silberschatz Professor, Henry F. Korth, S. SudarshanPublisher:McGraw-Hill Education
 Starting Out with Python (4th Edition)Computer ScienceISBN:9780134444321Author:Tony GaddisPublisher:PEARSON
 Digital Fundamentals (11th Edition)Computer ScienceISBN:9780132737968Author:Thomas L. FloydPublisher:PEARSON
  C How to Program (8th Edition)Computer ScienceISBN:9780133976892Author:Paul J. Deitel, Harvey DeitelPublisher:PEARSON
 Database Systems: Design, Implementation, & Manag...Computer ScienceISBN:9781337627900Author:Carlos Coronel, Steven MorrisPublisher:Cengage Learning
 Programmable Logic ControllersComputer ScienceISBN:9780073373843Author:Frank D. PetruzellaPublisher:McGraw-Hill Education
Database System Concepts
Computer Science
ISBN:9780078022159
Author:Abraham Silberschatz Professor, Henry F. Korth, S. Sudarshan
Publisher:McGraw-Hill Education
Starting Out with Python (4th Edition)
Computer Science
ISBN:9780134444321
Author:Tony Gaddis
Publisher:PEARSON
Digital Fundamentals (11th Edition)
Computer Science
ISBN:9780132737968
Author:Thomas L. Floyd
Publisher:PEARSON
C How to Program (8th Edition)
Computer Science
ISBN:9780133976892
Author:Paul J. Deitel, Harvey Deitel
Publisher:PEARSON
Database Systems: Design, Implementation, & Manag...
Computer Science
ISBN:9781337627900
Author:Carlos Coronel, Steven Morris
Publisher:Cengage Learning
Programmable Logic Controllers
Computer Science
ISBN:9780073373843
Author:Frank D. Petruzella
Publisher:McGraw-Hill Education