oup) was asked to consume the health drink for a certain period of time and the other group (the control group) nains the same or increases significantly relative to the control group. Let Yc denote the mean BMI of the con nsume the drink be Hy and the population mean for those who don't consume the drink be He. nich of the following hypotheses should be used to compare the causal effect of the health drink on the BMI in A. Ho: Hy- HC 0 vs. Hq: #y- Hc #0. B. Ho: HT-Hc=10 vs. H,: 47-Hc =0. C. Ho: HT-Hc =0 vs. H: HT-Hc = 10. D. Ho: HT -HC =0 vs. Hqi Hy -Hc>0. tnc and se be the number of individuals and the standard deviation of the control group, and let n- and s, be mplete the given table.
oup) was asked to consume the health drink for a certain period of time and the other group (the control group) nains the same or increases significantly relative to the control group. Let Yc denote the mean BMI of the con nsume the drink be Hy and the population mean for those who don't consume the drink be He. nich of the following hypotheses should be used to compare the causal effect of the health drink on the BMI in A. Ho: Hy- HC 0 vs. Hq: #y- Hc #0. B. Ho: HT-Hc=10 vs. H,: 47-Hc =0. C. Ho: HT-Hc =0 vs. H: HT-Hc = 10. D. Ho: HT -HC =0 vs. Hqi Hy -Hc>0. tnc and se be the number of individuals and the standard deviation of the control group, and let n- and s, be mplete the given table.

Holt Mcdougal Larson Pre-algebra: Student Edition 2012
1st Edition
ISBN:9780547587776
Author:HOLT MCDOUGAL
Publisher:HOLT MCDOUGAL
Chapter11: Data Analysis And Probability
Section: Chapter Questions
Problem 8CR

Related questions
Question
4
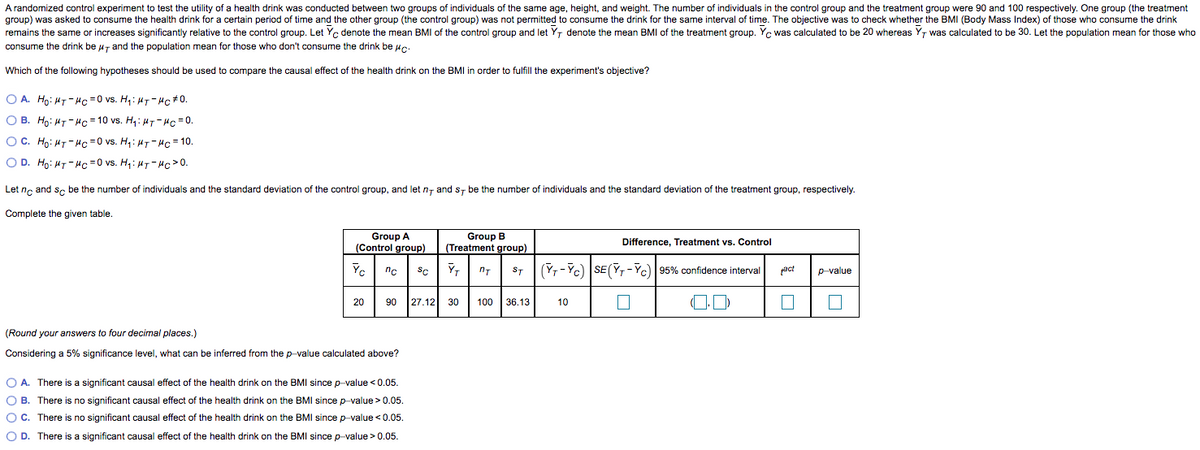
Transcribed Image Text:A randomized control experiment to test the utility of a health drink was conducted between two groups of individuals of the same age, height, and weight. The number of individuals in the control group and the treatment group were 90 and 100 respectively. One group (the treatment
group) was asked to consume the health drink for a certain period of time and the other group (the control group) was not permitted to consume the drink for the same interval of time. The objective was to check whether the BMI (Body Mass Index) of those who consume the drink
remains the same or increases significantly relative to the control group. Let Yc denote the mean BMI of the control group and let Y, denote the mean BMI of the treatment group. Yc was calculated to be 20 whereas Y, was calculated to be 30. Let the population mean for those who
consume the drink be u7 and the population mean for those who don't consume the drink be uc.
Which of the following hypotheses should be used to compare the causal effect of the health drink on the BMI in order to fulfill the experiment's objective?
O A. Ho: HT-Hc =0 vs. H,: HT- Hc+0.
O B. Ho: HT-Hc = 10 vs. H4: H7- Hc =0.
OC. Ho: HT- Hc =0 vs. H4: H7- Hc=10.
O D. Ho: HT- Hc =0 vs. H,: H7- Hc>0.
Let nc and se be the number of individuals and the standard deviation of the control group, and let n- and s, be the number of individuals and the standard deviation of the treatment group, respectively.
Complete the given table.
Group B
Group A
(Control group)
Difference, Treatment vs. Control
(Treatment group)
Yc
YT
(Yr -Yc) SE(Y,-Yc) 95% confidence interval
act
nc
SC
ST
p-value
20
90
27.12 30
100 | 36.13
10
(Round your answers to four decimal places.)
Considering a 5% significance level, what can be inferred from the p-value calculated above?
O A. There is a significant causal effect of the health drink on the BMI since p-value < 0.05.
O B. There is no significant causal effect of the health drink on the BMI since p-value> 0.05.
OC. There is no significant causal effect of the health drink on the BMI since p-value <0.05.
O D. There is a significant causal effect of the health drink on the BMI since p-value >0.05.
Expert Solution
This question has been solved!
Explore an expertly crafted, step-by-step solution for a thorough understanding of key concepts.

This is a popular solution!

Trending now
This is a popular solution!

Step by step
Solved in 3 steps with 3 images

Recommended textbooks for you
Holt Mcdougal Larson Pre-algebra: Student Edition…
Algebra
ISBN:
9780547587776
Author:
HOLT MCDOUGAL
Publisher:
HOLT MCDOUGAL

College Algebra (MindTap Course List)
Algebra
ISBN:
9781305652231
Author:
R. David Gustafson, Jeff Hughes
Publisher:
Cengage Learning

Holt Mcdougal Larson Pre-algebra: Student Edition…
Algebra
ISBN:
9780547587776
Author:
HOLT MCDOUGAL
Publisher:
HOLT MCDOUGAL
College Algebra (MindTap Course List)
Algebra
ISBN:
9781305652231
Author:
R. David Gustafson, Jeff Hughes
Publisher:
Cengage Learning