PAGASA provided the mean annual rainfall (in millimeters) in Cagayan Province from years 2000 2015. Rainfall measurements are as follows: 499.2, 555.2, 398.8, 391.9, 453.4, 459.8, 483.7, 417.6, 469.2, 452.4, 499.3, 340.6, 522.8, 469.9, 527.2, 565.5, 584.1, 727.3, 558.6, 338.6 Construct a 95% confidence interval for the mean annual rainfall. Does the data appear normally distributed? Include your solution. O. NONE O b.443.66 su s 527.94. Data appears to be normally distributed with only one outlier 200 300 400 500 Rainfal 600 Oc. 443.52 su s 528.08. The data appear to be normally distributed 200 300 500 Rainfal 400 600 O d. 443.52 su S 528.08. Data appears to be normally distributed with few outliers 200 300 500 600 700 800 ...R.
PAGASA provided the mean annual rainfall (in millimeters) in Cagayan Province from years 2000 2015. Rainfall measurements are as follows: 499.2, 555.2, 398.8, 391.9, 453.4, 459.8, 483.7, 417.6, 469.2, 452.4, 499.3, 340.6, 522.8, 469.9, 527.2, 565.5, 584.1, 727.3, 558.6, 338.6 Construct a 95% confidence interval for the mean annual rainfall. Does the data appear normally distributed? Include your solution. O. NONE O b.443.66 su s 527.94. Data appears to be normally distributed with only one outlier 200 300 400 500 Rainfal 600 Oc. 443.52 su s 528.08. The data appear to be normally distributed 200 300 500 Rainfal 400 600 O d. 443.52 su S 528.08. Data appears to be normally distributed with few outliers 200 300 500 600 700 800 ...R.

Glencoe Algebra 1, Student Edition, 9780079039897, 0079039898, 2018
18th Edition
ISBN:9780079039897
Author:Carter
Publisher:Carter
Chapter10: Statistics
Section10.5: Comparing Sets Of Data
Problem 13PPS

Related questions
Question
Please provide a clear and complete solution. Thank you very much.
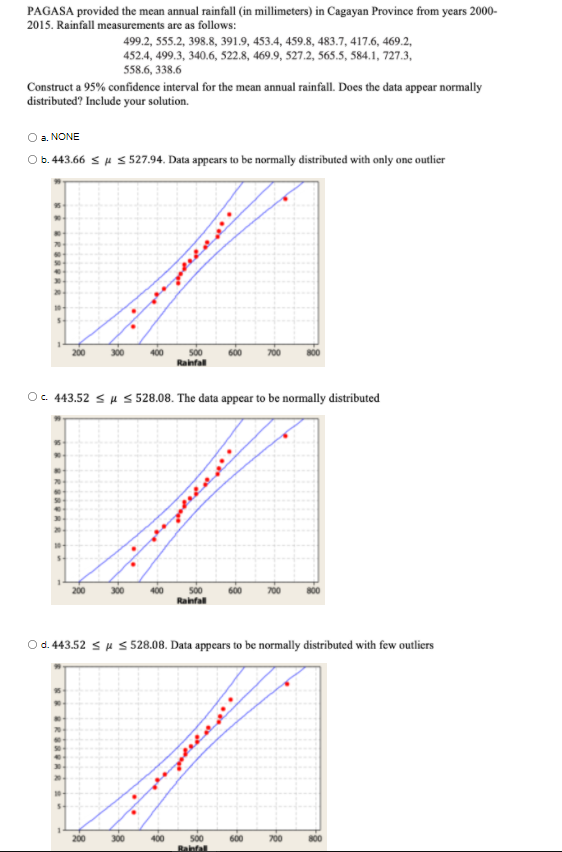
Transcribed Image Text:PAGASA provided the mean annual rainfall (in millimeters) in Cagayan Province from years 2000-
2015. Rainfall measurements are as follows:
499.2, 555.2, 398.8, 391.9, 453.4, 459.8, 483.7, 417.6, 469.2,
452.4, 499.3, 340.6, 522.8, 469.9, 527.2, 565.5, 584.1, 727.3,
558.6, 338.6
Construct a 95% confidence interval for the mean annual rainfall. Does the data appear normally
distributed? Include your solution.
a. NONE
b. 443.66 s u 5 527.94. Data appears to be normally distributed with only one outlier
200
300
400
500
Rainfall
600
700
O. 443.52 su S 528.08. The data appear to be normally distributed
200
300
400
600
700
Rainfal
d. 443.52 su S 528.08. Data appears to be normally distributed with few outliers
200
300
400
500
Banfal
600
700
800
Expert Solution
This question has been solved!
Explore an expertly crafted, step-by-step solution for a thorough understanding of key concepts.

Step by step
Solved in 2 steps

Recommended textbooks for you
Glencoe Algebra 1, Student Edition, 9780079039897…
Algebra
ISBN:
9780079039897
Author:
Carter
Publisher:
McGraw Hill

College Algebra (MindTap Course List)
Algebra
ISBN:
9781305652231
Author:
R. David Gustafson, Jeff Hughes
Publisher:
Cengage Learning

Holt Mcdougal Larson Pre-algebra: Student Edition…
Algebra
ISBN:
9780547587776
Author:
HOLT MCDOUGAL
Publisher:
HOLT MCDOUGAL
Glencoe Algebra 1, Student Edition, 9780079039897…
Algebra
ISBN:
9780079039897
Author:
Carter
Publisher:
McGraw Hill
College Algebra (MindTap Course List)
Algebra
ISBN:
9781305652231
Author:
R. David Gustafson, Jeff Hughes
Publisher:
Cengage Learning
Holt Mcdougal Larson Pre-algebra: Student Edition…
Algebra
ISBN:
9780547587776
Author:
HOLT MCDOUGAL
Publisher:
HOLT MCDOUGAL