
Related questions
Part C: Function, for and plotting
We did a project in the lecture on calculating the free fall speeds and plotting them on a graph. This part is similar to the project.
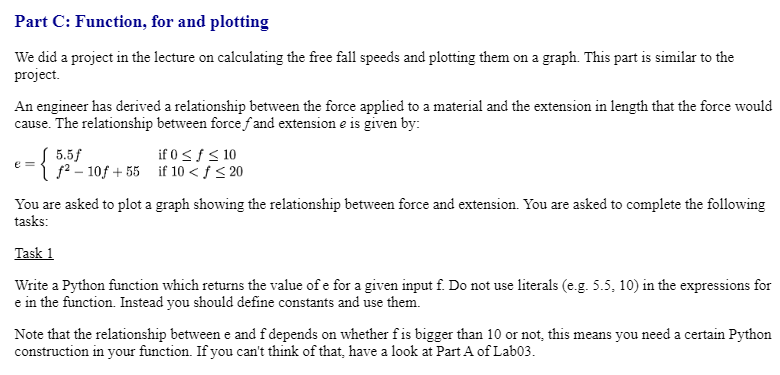
An engineer has derived a relationship between the force applied to a material and the extension in length that the force would cause. The relationship between force f and extension e is given by:
You are asked to plot a graph showing the relationship between force and extension. You are asked to complete the following tasks:
Task 1
Write a Python function which returns the value of e for a given input f. Do not use literals (e.g. 5.5, 10) in the expressions for e in the function. Instead you should define constants and use them.
Note that the relationship between e and f depends on whether f is bigger than 10 or not, this means you need a certain Python construction in your function. If you can't think of that, have a look at Part A of Lab03.


Trending nowThis is a popular solution!

Step by stepSolved in 4 steps with 3 images


- Code requirements: A robot is positioned on an integral point in a two-dimensional coordinate grid (xr, yr). There is a treasure that has been placed at a point in the same grid at (xt, yt). All x’s and y’s will be integral values. The robot can move up (North), down (South), left (West), or right (East). Commands can be given to the robot to move one position in one of the four direction. That is, “E” moves a robot one slot East (to the right) so if the robot was on position (3, 4), it would now be on (4, 4). The command N would move the robot one position north so a robot at position (4, 4) would be at (4, 5). Because the robot cannot move diagonally, the shortest distance between a robot at (xr, yr) and a treasure at (xt, yt) is | xr – xt | + | yr - yt | = ShortestPossibleDistance Write a recursive program which determines all the unique shortest possible paths from the robot to the treasure with the following stipulation: The robot may never move in the same direction more than…arrow_forwardQ3: Write a matlab program call matq3.m that returns the plot of the 2- D space defined by the following equation: (-xsin(x) cos (x) - 2π ≤ x < 0 x ≥ 2π Label the x-axis and y-axis and z-axis and title to the curve. y =arrow_forwardComputer Science Investing in stocks is a way to create assets that are supposed to provide financial security over time. In solving this problem, we assume that an investor buys several shares of stock at a certain price. These shares are going to be sold later on for a different price. Obviously, if the selling price is higher than the acquisition price, the investor makes a profit, registering capital gain. If the shares are sold at a lower price, the investor has a loss, which marks a negative capital gain. This whole process is done over a period of time, and you are required to create a scenario for buying and selling shares. The assumption is that the investor sells shares in the order in which they were purchased. The goal is to calculate the capital gain over time. Suppose that you buy n shares of stock or mutual fund for d dollars each. Later, you sell some of these shares. If the sale price exceeds the purchase price, you have made a profit—a capital gain. On the other…arrow_forward
- Database System ConceptsComputer ScienceISBN:9780078022159Author:Abraham Silberschatz Professor, Henry F. Korth, S. SudarshanPublisher:McGraw-Hill Education
 Starting Out with Python (4th Edition)Computer ScienceISBN:9780134444321Author:Tony GaddisPublisher:PEARSON
 Digital Fundamentals (11th Edition)Computer ScienceISBN:9780132737968Author:Thomas L. FloydPublisher:PEARSON
  C How to Program (8th Edition)Computer ScienceISBN:9780133976892Author:Paul J. Deitel, Harvey DeitelPublisher:PEARSON
 Database Systems: Design, Implementation, & Manag...Computer ScienceISBN:9781337627900Author:Carlos Coronel, Steven MorrisPublisher:Cengage Learning
 Programmable Logic ControllersComputer ScienceISBN:9780073373843Author:Frank D. PetruzellaPublisher:McGraw-Hill Education