Part II: Match each rate with a table and graph. TABLE (A-D) GRAPH (W-Z) 5. Rate of 2 feet per second 6. Rate of -2 feet per second 7. Rate of 1 foot per second 8. Rate of -1 foot per second Time (sec) Dist (ft) Time (sec) Dist (ft) A. В. 4 2 8. 10 4 10 14 12 14 C. Time (sec) Dist (ft) D. Time (sec) Dist (ft) 12 12 4. 8. 2. 8. 4 4. 4 12
Part II: Match each rate with a table and graph. TABLE (A-D) GRAPH (W-Z) 5. Rate of 2 feet per second 6. Rate of -2 feet per second 7. Rate of 1 foot per second 8. Rate of -1 foot per second Time (sec) Dist (ft) Time (sec) Dist (ft) A. В. 4 2 8. 10 4 10 14 12 14 C. Time (sec) Dist (ft) D. Time (sec) Dist (ft) 12 12 4. 8. 2. 8. 4 4. 4 12

Algebra for College Students
10th Edition
ISBN:9781285195780
Author:Jerome E. Kaufmann, Karen L. Schwitters
Publisher:Jerome E. Kaufmann, Karen L. Schwitters
Chapter11: Systems Of Equations
Section11.CT: Test
Problem 24CT

Related questions
Question
Transcribed Image Text:rectory Z00MA
- Post Attendee-Zoom
A To do
M (no subject) - enely rodriguez@ri x
O EOU3 Review 20/21
a goformative.com/formatives/602031577b5452190d914954
marks
A Classes Login - Powered by.
M Inbox (6) - enely.rod. M Agile Mind - My Ag.
+ Faculty/Staff Direct.
O Formative
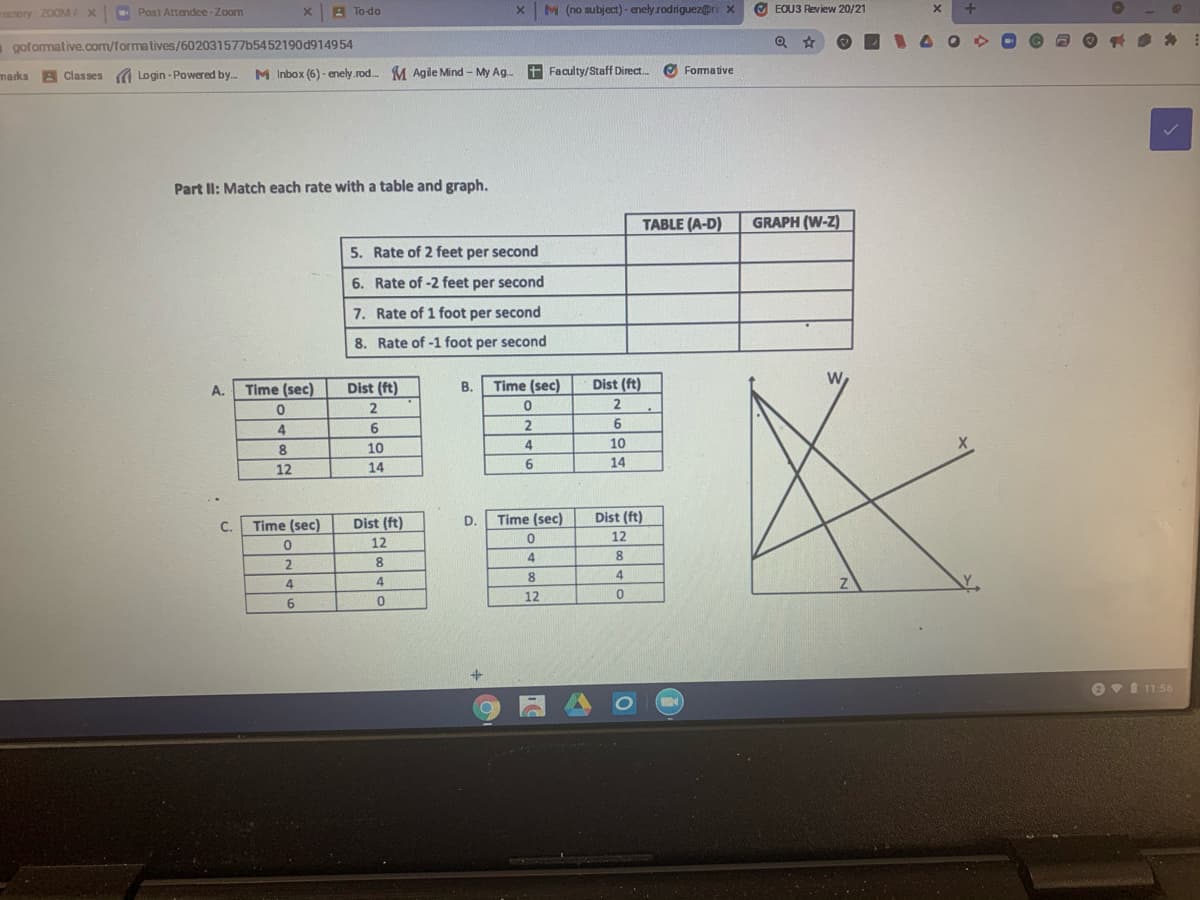
Part II: Match each rate with a table and graph.
TABLE (A-D)
GRAPH (W-Z)
5. Rate of 2 feet per second
6. Rate of -2 feet per second
7. Rate of 1 foot per second
8. Rate of -1 foot per second
W.
A.
Time (sec)
Dist (ft)
В.
Time (sec)
Dist (ft)
2
4
6
6
8
10
4
10
12
14
6.
14
Time (sec)
Dist (ft)
D.
Time (sec)
Dist (ft)
С.
12
12
2
8.
8
4
4.
4
12
OvI 11.56
Transcribed Image Text:detector in feet
Distance from motion
fry/Stafl Directory: 20OMA
Post Attendee-Zoom
O EOU3 Review 20/21
x zanbupor Aau - (130lgns ou) X
op oL
goformative.com/formatives/602031577b54 52190d914954
to
corg bookmarks A Classes Login - Powered by.
M Inbox (6) - enely.rod. M Agile Mind - My Ag.
+ Faculty/Staff Direct.
Formative
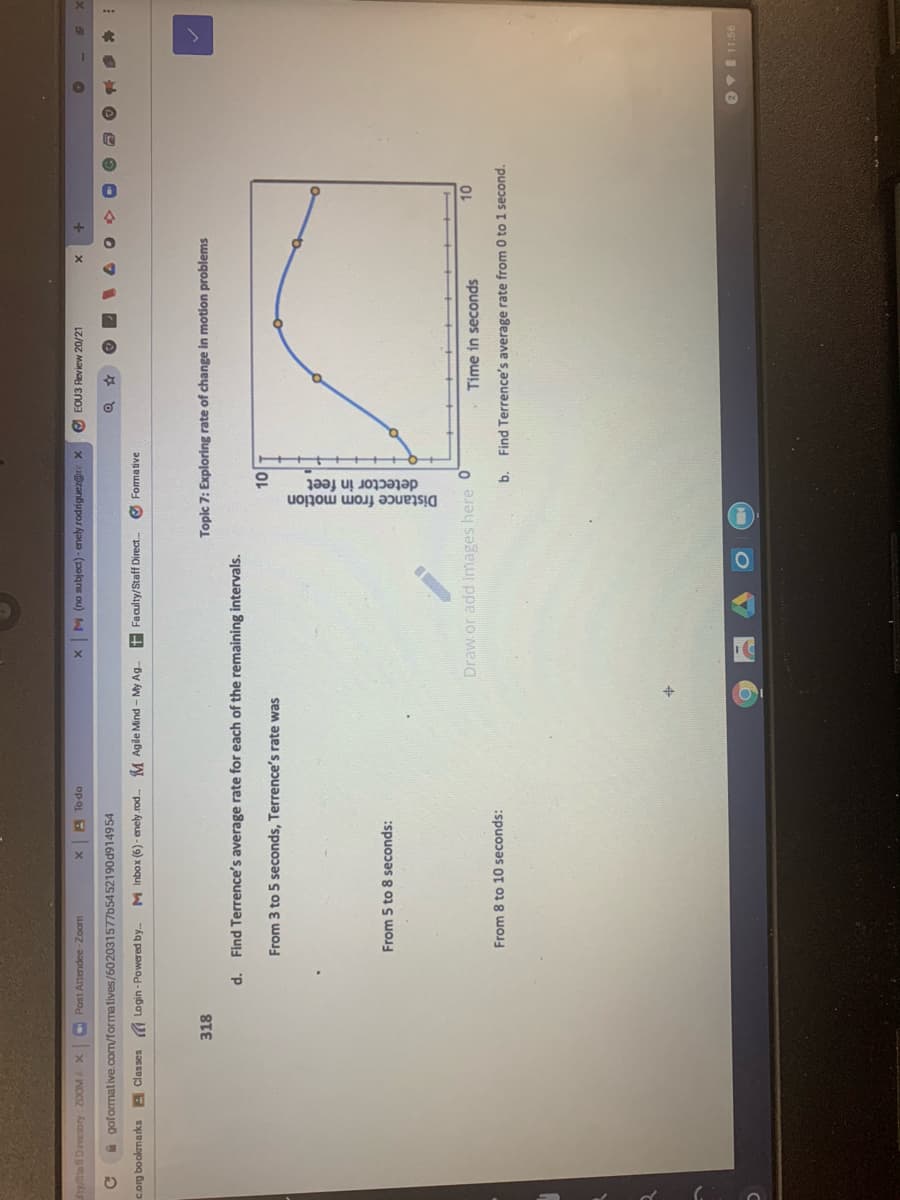
318
Topic 7: Exploring rate of change in motion problems
d. Find Terrence's average rate for each of the remaining intervals.
From 3 to 5 seconds, Terrence's rate was
to
From 5 to 8 seconds:
Draw.or add images here 0
- Time in seconds
From 8 to 10 seconds:
b. Find Terrence's average rate from 0 to 1 second.
Expert Solution
This question has been solved!
Explore an expertly crafted, step-by-step solution for a thorough understanding of key concepts.

This is a popular solution!

Trending now
This is a popular solution!

Step by step
Solved in 2 steps with 2 images

Knowledge Booster


Learn more about
Need a deep-dive on the concept behind this application? Look no further. Learn more about this topic, algebra and related others by exploring similar questions and additional content below.Recommended textbooks for you
Algebra for College Students
Algebra
ISBN:
9781285195780
Author:
Jerome E. Kaufmann, Karen L. Schwitters
Publisher:
Cengage Learning

Linear Algebra: A Modern Introduction
Algebra
ISBN:
9781285463247
Author:
David Poole
Publisher:
Cengage Learning
Algebra for College Students
Algebra
ISBN:
9781285195780
Author:
Jerome E. Kaufmann, Karen L. Schwitters
Publisher:
Cengage Learning
Linear Algebra: A Modern Introduction
Algebra
ISBN:
9781285463247
Author:
David Poole
Publisher:
Cengage Learning