Perform a hypothesis test to determine whether there is a difference in the mean attendance of teams between the two groups created in Part F. Use a 0.05 level of significance in your testing procedures. SPACE Hint: When calculating your pooled sample variance and your test statistic, assume the Top 10 data is sample 1 and the Bottom 10 data is sample 2. space Decision Rule -t < or t > = REJECT H0 Value of Pooled Sample Variances Value of test statistic Decision: enter Reject or Do Not Reject SPACE Is there a difference in the mean attendance between the two groups assuming a 0.05 level of significance? Enter Yes or No. space space space Another variable that can impact attendance is the team's win-loss record. Teams that are winning more games are thought to have increased attendance as fans prefer to see their home team "win" rather than "lose" (although for some teams such as the Chicago Cubs, this is not always an established relationship!). Create 2 samples based on Wins and calculate average wins, wins variance, and wins standard deviation for each sample. Sample 1 = 10 teams with the highest wins Sample 2 = 10 teams with the lowest wins space See above tip for sorting advice in Excel... space Sample 1 Sample 2 Top 10 Wins Bottom 10 Wins Sample mean attendance mil mil Sample attendance variance mil mil Sample attendance standard deviation mil mil


- Perform a hypothesis test to determine whether there is a difference in the mean attendance of teams between the two groups created in Part F. Use a 0.05 level of significance in your testing procedures.
SPACE
Hint: When calculating your pooled sample variance and your test statistic, assume the Top 10 data is sample 1 and the Bottom 10 data is sample 2.
space
|
Decision Rule |
-t < or t > = REJECT H0 |
|
Value of Pooled Sample Variances |
|
|
Value of test statistic |
|
|
Decision: enter Reject or Do Not Reject |
SPACE
Is there a difference in the mean attendance between the two groups assuming a 0.05 level of significance? Enter Yes or No.
space
space
space
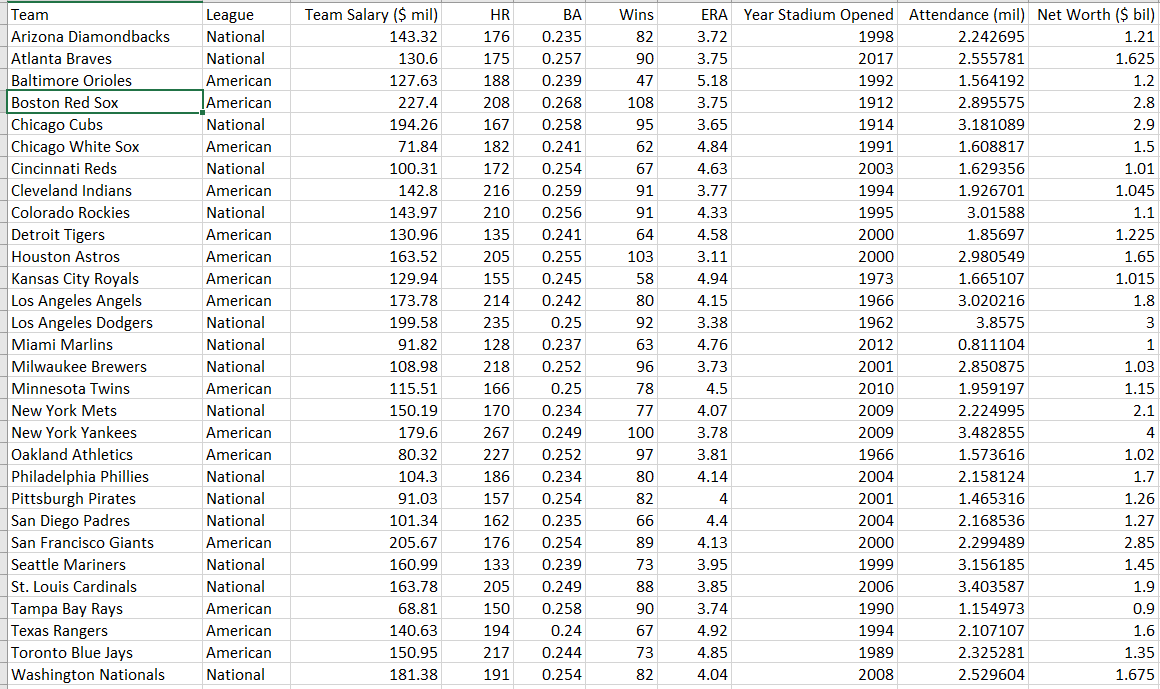
Another variable that can impact attendance is the team's win-loss record. Teams that are winning more games are thought to have increased attendance as fans prefer to see their home team "win" rather than "lose" (although for some teams such as the Chicago Cubs, this is not always an established relationship!).
- Create 2 samples based on Wins and calculate average wins, wins variance, and wins standard deviation for each sample.
- Sample 1 = 10 teams with the highest wins
- Sample 2 = 10 teams with the lowest wins
space
See above tip for sorting advice in Excel...
space
|
|
Sample 1 |
Sample 2 |
|
|
Top 10 Wins |
Bottom 10 Wins |
|
Sample mean attendance |
mil |
mil |
|
Sample attendance variance |
mil |
mil |
|
Sample attendance standard deviation |
mil |
mil |
SPACE
APCE
- Perform a hypothesis test to determine whether there is a difference in the mean attendance of teams between the two groups created in Part H. Use a 0.05 level of significance in your testing procedures.
SPACE
Hint: When calculating your pooled sample variance and your test statistic, assume the Top 10 data is sample 1 and the Bottom 10 data is sample 2.
space
|
Decision Rule |
-t < or t > = REJECT H0 |
|
Value of Pooled Sample Variances |
|
|
Value of test statistic |
|
|
Decision: enter Reject or Do Not Reject |
SPACE
Is there a difference in the mean attendance between the two groups assuming a 0.05 level of significance? Enter Yes or No.


Trending now
This is a popular solution!

Step by step
Solved in 6 steps with 11 images


