Please review Section 11.1. Are you an impulse shopper? A survey of 800 grocery shoppers indicated that 36% of males and 42% of females make an impulse purchase every time they shop. Assume that the survey consisted of 400 males and 400 females. Let group 1 be the males and let group 2 be the females. a = 0.01 H,:T, = R, H :, # R, Calculate the test statistic: (Round to three decimal places as needed.) Determine the critical value: (Round to three decimal places as needed.) State the Conclusion: Please review Section 12.2. An agent for a residential real estate company in a suburb located outside a major city has the business objective of developing more accurate estimates of the monthly rental cost for apartments. Toward the goal, the agent would like to use the size of an apartment, as defined by square footage to predict the monthly rental cost. The agent selects a sample of 8 one-bedroom apartments and the data are shown. Size (Square Feet) Monthly Rent ($) 875 1550 850 1350 950 825 1200 1600 1900 925 1800 1800 700 1300 1050 1300 Construct a scatterplot. Size is the x value and Monthly Rent is the y value. You can hand-draw, or use technology...label appropriately. Use the least-squares method to determine the regression coefficients. If you use technology, include the documents or screen shots: bo = b = (Round to one decimal place as needed.) (Round to one decimal place as needed.)
Please review Section 11.1. Are you an impulse shopper? A survey of 800 grocery shoppers indicated that 36% of males and 42% of females make an impulse purchase every time they shop. Assume that the survey consisted of 400 males and 400 females. Let group 1 be the males and let group 2 be the females. a = 0.01 H,:T, = R, H :, # R, Calculate the test statistic: (Round to three decimal places as needed.) Determine the critical value: (Round to three decimal places as needed.) State the Conclusion: Please review Section 12.2. An agent for a residential real estate company in a suburb located outside a major city has the business objective of developing more accurate estimates of the monthly rental cost for apartments. Toward the goal, the agent would like to use the size of an apartment, as defined by square footage to predict the monthly rental cost. The agent selects a sample of 8 one-bedroom apartments and the data are shown. Size (Square Feet) Monthly Rent ($) 875 1550 850 1350 950 825 1200 1600 1900 925 1800 1800 700 1300 1050 1300 Construct a scatterplot. Size is the x value and Monthly Rent is the y value. You can hand-draw, or use technology...label appropriately. Use the least-squares method to determine the regression coefficients. If you use technology, include the documents or screen shots: bo = b = (Round to one decimal place as needed.) (Round to one decimal place as needed.)

Glencoe Algebra 1, Student Edition, 9780079039897, 0079039898, 2018
18th Edition
ISBN:9780079039897
Author:Carter
Publisher:Carter
Chapter10: Statistics
Section10.1: Measures Of Center
Problem 9PPS

Related questions
Question
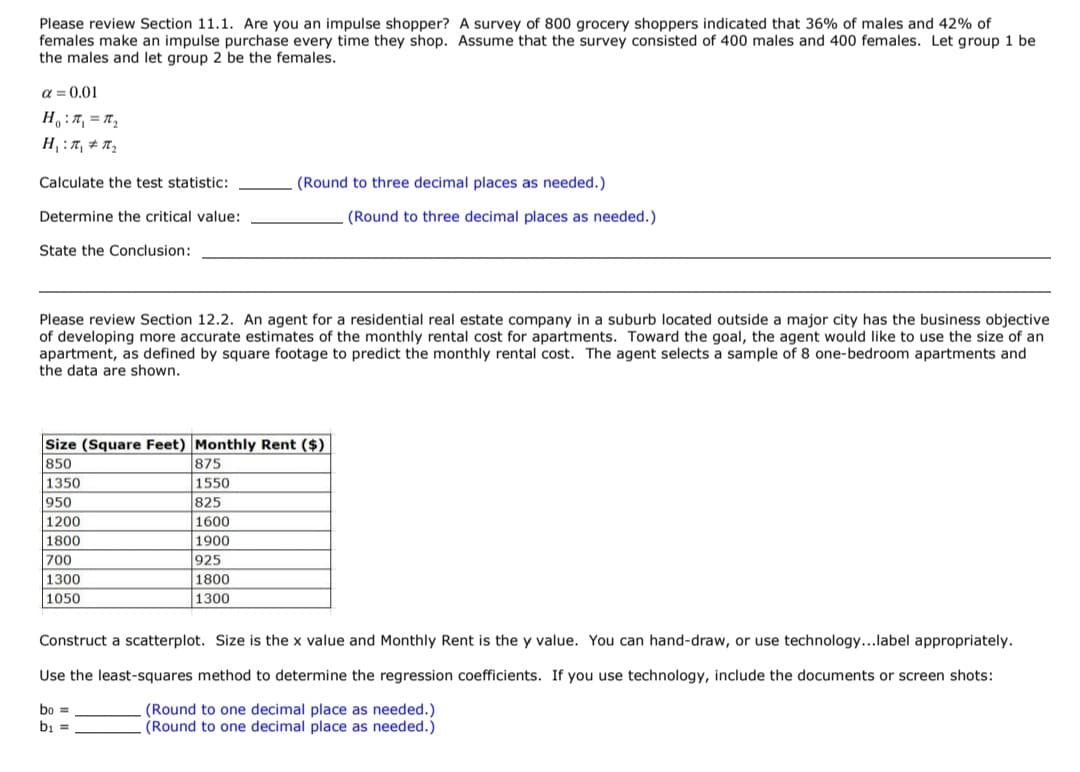
Transcribed Image Text:Please review Section 11.1. Are you an impulse shopper? A survey of 800 grocery shoppers indicated that 36% of males and 42% of
females make an impulse purchase every time they shop. Assume that the survey consisted of 400 males and 400 females. Let group 1 be
the males and let group 2 be the females.
a = 0.01
H, :T, = R,
H :, # R,
Calculate the test statistic:
(Round to three decimal places as needed.)
Determine the critical value:
(Round to three decimal places as needed.)
State the Conclusion:
Please review Section 12.2. An agent for a residential real estate company in a suburb located outside a major city has the business objective
of developing more accurate estimates of the monthly rental cost for apartments. Toward the goal, the agent would like to use the size of an
apartment, as defined by square footage to predict the monthly rental cost. The agent selects a sample of 8 one-bedroom apartments and
the data are shown.
Size (Square Feet) Monthly Rent ($)
875
1550
850
1350
950
825
1200
1600
1900
925
1800
1800
700
1300
1050
1300
Construct a scatterplot. Size is the x value and Monthly Rent is the y value. You can hand-draw, or use technology...label appropriately.
Use the least-squares method to determine the regression coefficients. If you use technology, include the documents or screen shots:
bo =
b =
(Round to one decimal place as needed.)
(Round to one decimal place as needed.)
Expert Solution
This question has been solved!
Explore an expertly crafted, step-by-step solution for a thorough understanding of key concepts.

Step by step
Solved in 2 steps with 2 images

Recommended textbooks for you
Glencoe Algebra 1, Student Edition, 9780079039897…
Algebra
ISBN:
9780079039897
Author:
Carter
Publisher:
McGraw Hill
Glencoe Algebra 1, Student Edition, 9780079039897…
Algebra
ISBN:
9780079039897
Author:
Carter
Publisher:
McGraw Hill