policy. The following table reports the number of cars and light duty trucks sold by the eight largest automakers in the first two months of 2010 compared to the first two months of 2009. Year-to-Date Sales Through February 2010 Through February 2009 Manufacturer General Motors Corp. Ford Motor Company 287,242 249,514 141,592 198,823 148,150 132,761 252,701 185,825 146,207 226,870 142,606 108,133 Chrysler LLC Toyota Motor Sales USA Inc. American Honda Motor Co. Inc. Nissan North America Inc. Hyundai Motor America Mazda Motor of America Inc. 64,507 32,748 55,133 31,821 a. Compare the total sales for the eight automakers. Has there been an increase or a decrease in sales for 2010 compared to the same period in 2009? b. Compute the market share for each of the companies. Has there been a large change in the market share for any of the companies? c. Compute the percentage change in sales for each of the eight companies. Which com- panies had a significant change in sales? ge amounts spent by consumers on holiday gifts.
policy. The following table reports the number of cars and light duty trucks sold by the eight largest automakers in the first two months of 2010 compared to the first two months of 2009. Year-to-Date Sales Through February 2010 Through February 2009 Manufacturer General Motors Corp. Ford Motor Company 287,242 249,514 141,592 198,823 148,150 132,761 252,701 185,825 146,207 226,870 142,606 108,133 Chrysler LLC Toyota Motor Sales USA Inc. American Honda Motor Co. Inc. Nissan North America Inc. Hyundai Motor America Mazda Motor of America Inc. 64,507 32,748 55,133 31,821 a. Compare the total sales for the eight automakers. Has there been an increase or a decrease in sales for 2010 compared to the same period in 2009? b. Compute the market share for each of the companies. Has there been a large change in the market share for any of the companies? c. Compute the percentage change in sales for each of the eight companies. Which com- panies had a significant change in sales? ge amounts spent by consumers on holiday gifts.

MATLAB: An Introduction with Applications
6th Edition
ISBN:9781119256830
Author:Amos Gilat
Publisher:Amos Gilat
Chapter1: Starting With Matlab
Section: Chapter Questions
Problem 1P

Related questions
Topic Video
Question
Transcribed Image Text:UK TU0
מ ל
tO Compiete the tI ul
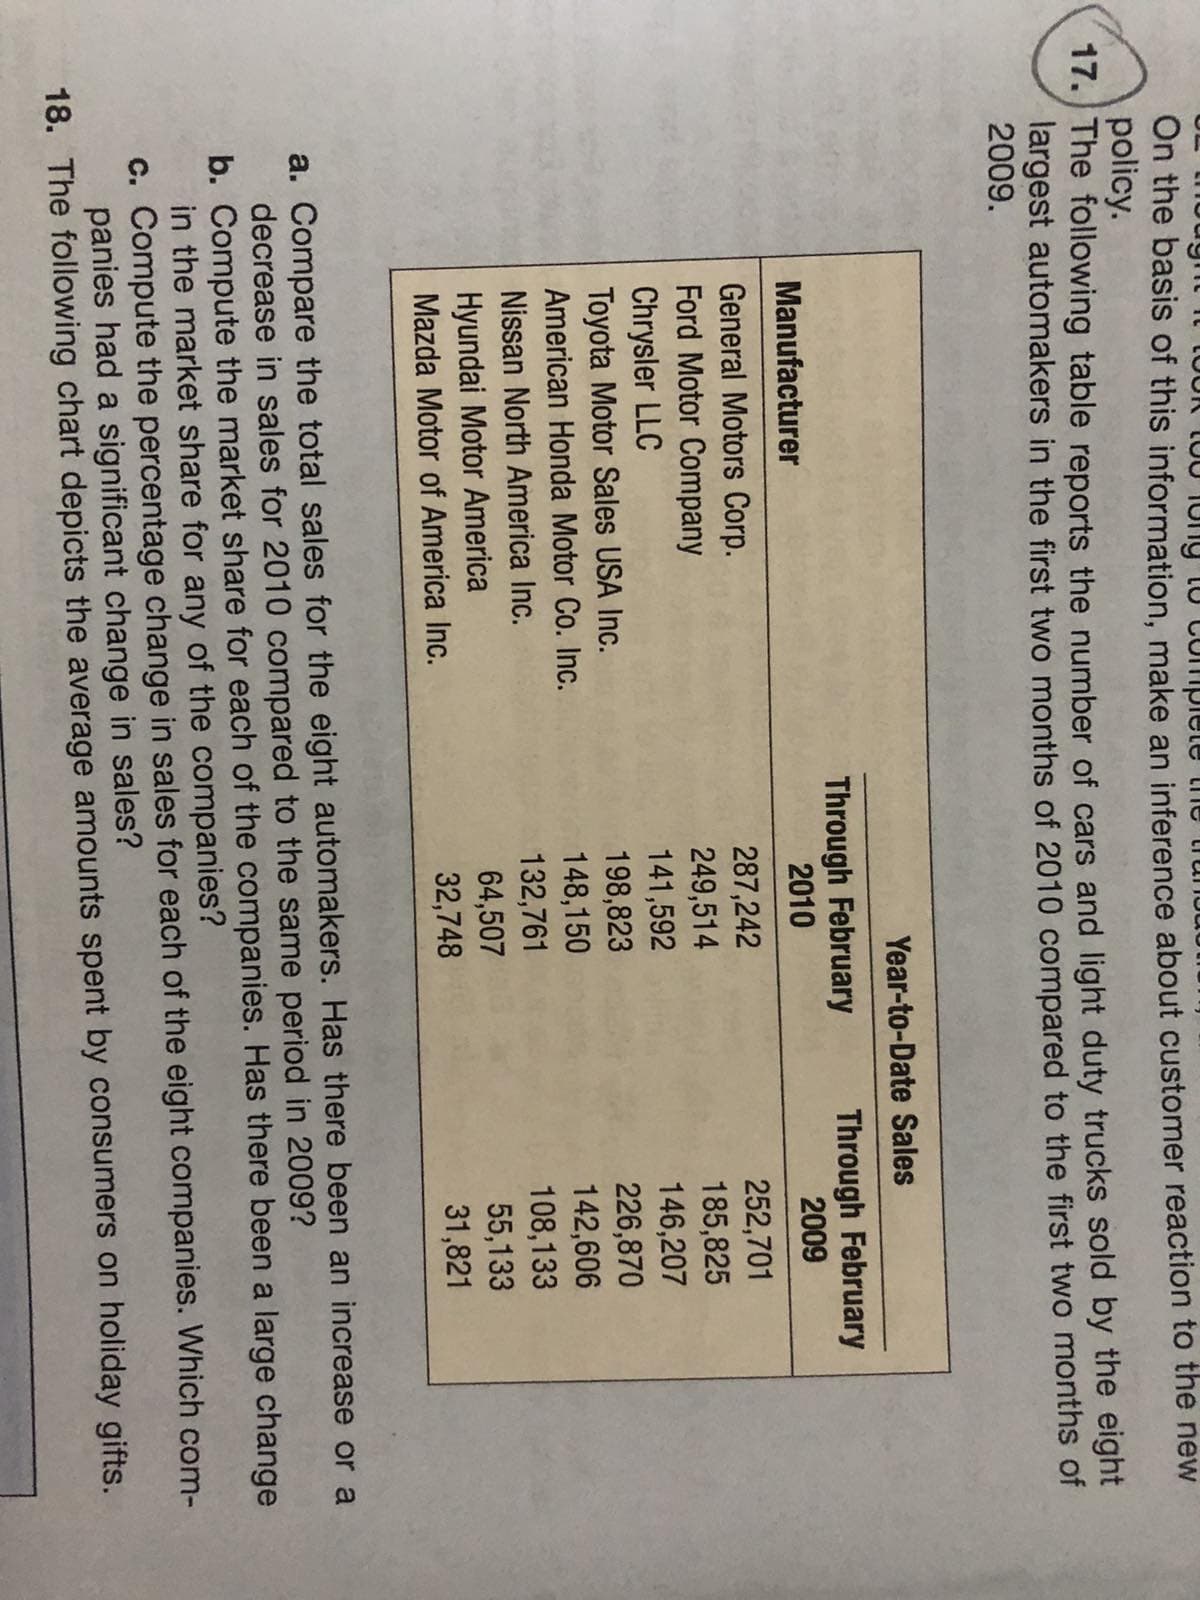
On the basis of this information, make an inference about customer reaction to the new
policy.
17. The following table reports the number of cars and light duty trucks sold by the eight
largest automakers in the first two months of 2010 compared to the first two months of
2009.
Year-to-Date Sales
Through February
2010
Through February
2009
Manufacturer
252,701
185,825
146,207
226,870
142,606
108,133
55,133
31,821
General Motors Corp.
Ford Motor Company
Chrysler LLC
Toyota Motor Sales USA Inc.
American Honda Motor Co. Inc.
287,242
249,514
141,592
198,823
148,150
132,761
64,507
32,748
Nissan North America Inc.
Hyundai Motor America
Mazda Motor of America Inc.
a. Compare the total sales for the eight automakers. Has there been an increase or a
decrease in sales for 2010 compared to the same period in 2009?
b. Compute the market share for each of the companies. Has there been a large change
in the market share for any of the companies?
c. Compute the percentage change in sales for each of the eight companies. Which com-
panies had a significant change in sales?
18. The following chart depicts the average amounts spent by consumers on holiday gifts.
Expert Solution
This question has been solved!
Explore an expertly crafted, step-by-step solution for a thorough understanding of key concepts.

This is a popular solution!

Trending now
This is a popular solution!

Step by step
Solved in 3 steps

Knowledge Booster


Learn more about
Need a deep-dive on the concept behind this application? Look no further. Learn more about this topic, statistics and related others by exploring similar questions and additional content below.Recommended textbooks for you
MATLAB: An Introduction with Applications
Statistics
ISBN:
9781119256830
Author:
Amos Gilat
Publisher:
John Wiley & Sons Inc

Probability and Statistics for Engineering and th…
Statistics
ISBN:
9781305251809
Author:
Jay L. Devore
Publisher:
Cengage Learning

Statistics for The Behavioral Sciences (MindTap C…
Statistics
ISBN:
9781305504912
Author:
Frederick J Gravetter, Larry B. Wallnau
Publisher:
Cengage Learning
MATLAB: An Introduction with Applications
Statistics
ISBN:
9781119256830
Author:
Amos Gilat
Publisher:
John Wiley & Sons Inc
Probability and Statistics for Engineering and th…
Statistics
ISBN:
9781305251809
Author:
Jay L. Devore
Publisher:
Cengage Learning
Statistics for The Behavioral Sciences (MindTap C…
Statistics
ISBN:
9781305504912
Author:
Frederick J Gravetter, Larry B. Wallnau
Publisher:
Cengage Learning

Elementary Statistics: Picturing the World (7th E…
Statistics
ISBN:
9780134683416
Author:
Ron Larson, Betsy Farber
Publisher:
PEARSON

The Basic Practice of Statistics
Statistics
ISBN:
9781319042578
Author:
David S. Moore, William I. Notz, Michael A. Fligner
Publisher:
W. H. Freeman

Introduction to the Practice of Statistics
Statistics
ISBN:
9781319013387
Author:
David S. Moore, George P. McCabe, Bruce A. Craig
Publisher:
W. H. Freeman