Price Quantity Demanded Quantity Supplied (Dollars per pair of shoes) (Pairs of shoes) (Pairs of shoes) 20 1,100 200 40 900 400 60 800 500 80 600 900 100 500 1,200 On the following graph, plot the demand for shoes using the blue point (circle symbol). Next, plot the supply of shoes using the orange point (square symbol). Finally, use the black point (plus symbol) to indicate the equilibrium price and quantity in the market for shoes. Note: Plot your points in the order in which you would like them connected. Line segments will connect the points automatically.
Price Quantity Demanded Quantity Supplied (Dollars per pair of shoes) (Pairs of shoes) (Pairs of shoes) 20 1,100 200 40 900 400 60 800 500 80 600 900 100 500 1,200 On the following graph, plot the demand for shoes using the blue point (circle symbol). Next, plot the supply of shoes using the orange point (square symbol). Finally, use the black point (plus symbol) to indicate the equilibrium price and quantity in the market for shoes. Note: Plot your points in the order in which you would like them connected. Line segments will connect the points automatically.

Brief Principles of Macroeconomics (MindTap Course List)
8th Edition
ISBN:9781337091985
Author:N. Gregory Mankiw
Publisher:N. Gregory Mankiw
Chapter4: The Market Forces Of Supply And Demand
Section: Chapter Questions
Problem 8PA

Related questions
Question
100%
Please give a detailed solution with an explanation. For the graph make sure it is readable, visible, and make sure you clearly label the x and y coordinates and the graph movement (if applicable).
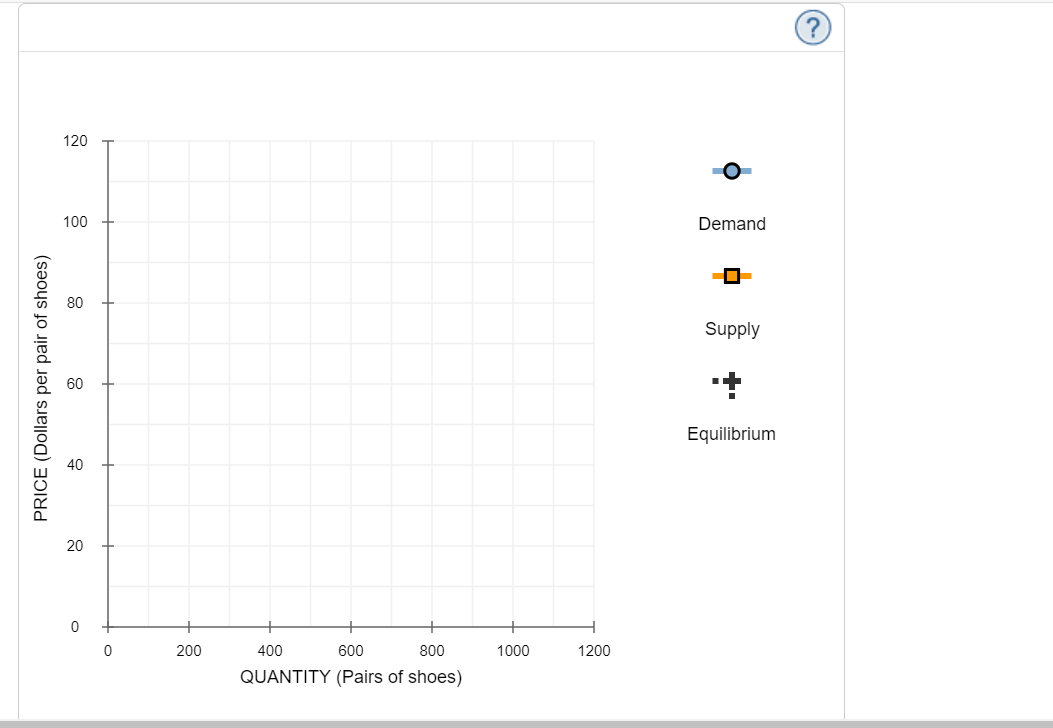
Transcribed Image Text:120
100
Demand
80
Supply
Equilibrium
20
200
400
600
800
1000
1200
QUANTITY (Pairs of shoes)
PRICE (Dollars per pair of shoes)
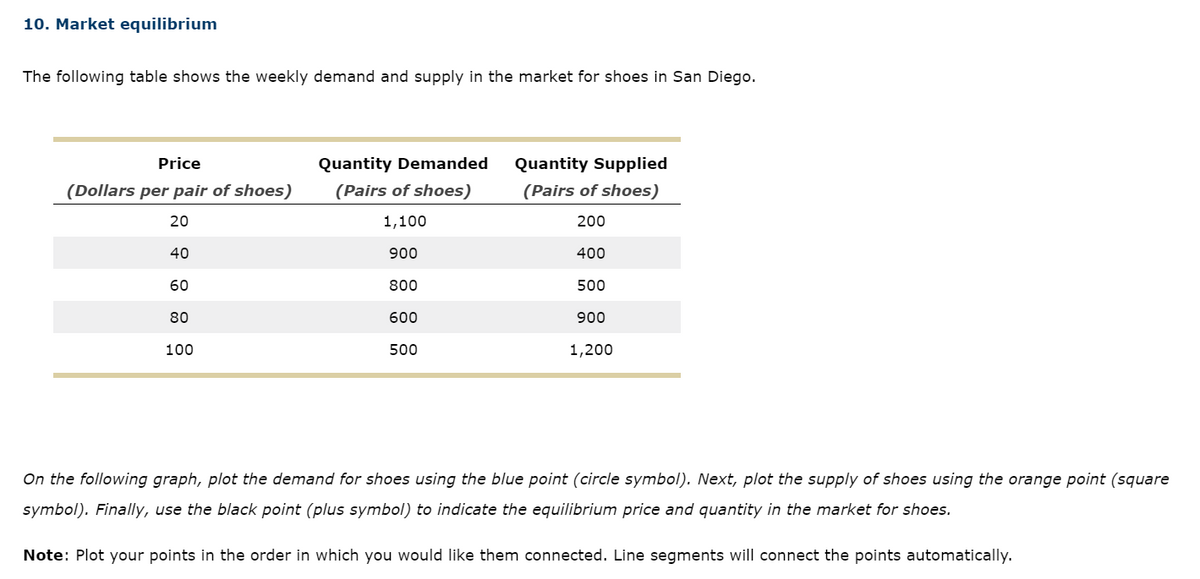
Transcribed Image Text:10. Market equilibrium
The following table shows the weekly demand and supply in the market for shoes in San Diego.
Price
Quantity Demanded
Quantity Supplied
(Dollars per pair of shoes)
(Pairs of shoes)
(Pairs of shoes)
20
1,100
200
40
900
400
60
800
500
80
600
900
100
500
1,200
On the following graph, plot the demand for shoes using the blue point (circle symbol). Next, plot the supply of shoes using the orange point (square
symbol). Finally, use the black point (plus symbol) to indicate the equilibrium price and quantity in the market for shoes.
Note: Plot your points in the order in which you would like them connected. Line segments will connect the points automatically.
Expert Solution
This question has been solved!
Explore an expertly crafted, step-by-step solution for a thorough understanding of key concepts.

This is a popular solution!

Trending now
This is a popular solution!

Step by step
Solved in 2 steps with 1 images

Knowledge Booster


Learn more about
Need a deep-dive on the concept behind this application? Look no further. Learn more about this topic, economics and related others by exploring similar questions and additional content below.Recommended textbooks for you
Brief Principles of Macroeconomics (MindTap Cours…
Economics
ISBN:
9781337091985
Author:
N. Gregory Mankiw
Publisher:
Cengage Learning

Essentials of Economics (MindTap Course List)
Economics
ISBN:
9781337091992
Author:
N. Gregory Mankiw
Publisher:
Cengage Learning

Principles of Economics 2e
Economics
ISBN:
9781947172364
Author:
Steven A. Greenlaw; David Shapiro
Publisher:
OpenStax
Brief Principles of Macroeconomics (MindTap Cours…
Economics
ISBN:
9781337091985
Author:
N. Gregory Mankiw
Publisher:
Cengage Learning
Essentials of Economics (MindTap Course List)
Economics
ISBN:
9781337091992
Author:
N. Gregory Mankiw
Publisher:
Cengage Learning
Principles of Economics 2e
Economics
ISBN:
9781947172364
Author:
Steven A. Greenlaw; David Shapiro
Publisher:
OpenStax


Principles of Microeconomics
Economics
ISBN:
9781305156050
Author:
N. Gregory Mankiw
Publisher:
Cengage Learning
