Draw a demand and supply graph for each of the following questions. For each question, start by drawing a correctly labeled graph of the market for cookies in equilibrium. Your starting graphs should each have correctly labeled axes and demand and supply curves. Label the equilibrium price and quantity as p1 and p2 on the axes of each of the starting graphs. 1. Show the effect on the equilibrium price and quantity in the market for cookies if the price of milk increases. Determine which curve is affected by the change in the price of milk and whether it increases or decreases. On your graph, draw a new curve indicating the shift- either to the right or the left. Label the new equilibrium price and quantity as p2 and q2. 2. Show the effect on the equilibrium price and quantity in the market for cookies if the price of flour decreases. Determine which curve is affected by the change in the price of flour and whether it increases or decreases. On your graph, draw a new curve indicating the shift- either to the right or the left. Label the new equilibrium price and quantity as p2 and g2.
Draw a demand and supply graph for each of the following questions. For each question, start by drawing a correctly labeled graph of the market for cookies in equilibrium. Your starting graphs should each have correctly labeled axes and demand and supply curves. Label the equilibrium price and quantity as p1 and p2 on the axes of each of the starting graphs. 1. Show the effect on the equilibrium price and quantity in the market for cookies if the price of milk increases. Determine which curve is affected by the change in the price of milk and whether it increases or decreases. On your graph, draw a new curve indicating the shift- either to the right or the left. Label the new equilibrium price and quantity as p2 and q2. 2. Show the effect on the equilibrium price and quantity in the market for cookies if the price of flour decreases. Determine which curve is affected by the change in the price of flour and whether it increases or decreases. On your graph, draw a new curve indicating the shift- either to the right or the left. Label the new equilibrium price and quantity as p2 and g2.

Chapter4: Demand, Supply, And Market Equilibrium
Section: Chapter Questions
Problem 25P

Related questions
Question
Answer this for me mate. Much appreciated.
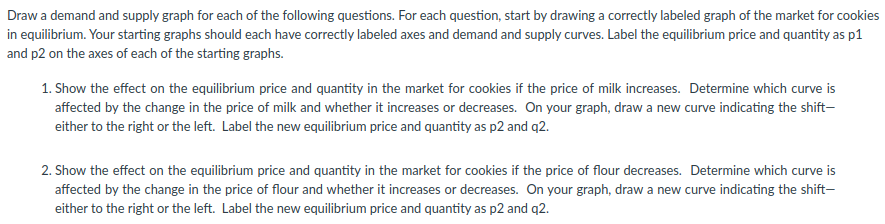
Transcribed Image Text:Draw a demand and supply graph for each of the following questions. For each question, start by drawing a correctly labeled graph of the market for cookies
in equilibrium. Your starting graphs should each have correctly labeled axes and demand and supply curves. Label the equilibrium price and quantity as p1
and p2 on the axes of each of the starting graphs.
1. Show the effect on the equilibrium price and quantity in the market for cookies if the price of milk increases. Determine which curve is
affected by the change in the price of milk and whether it increases or decreases. On your graph, draw a new curve indicating the shift-
either to the right or the left. Label the new equilibrium price and quantity as p2 and q2.
2. Show the effect on the equilibrium price and quantity in the market for cookies if the price of flour decreases. Determine which curve is
affected by the change in the price of flour and whether it increases or decreases. On your graph, draw a new curve indicating the shift-
either to the right or the left. Label the new equilibrium price and quantity as p2 and q2.
Expert Solution
This question has been solved!
Explore an expertly crafted, step-by-step solution for a thorough understanding of key concepts.

This is a popular solution!

Trending now
This is a popular solution!

Step by step
Solved in 2 steps with 2 images

Recommended textbooks for you
Exploring Economics
Economics
ISBN:
9781544336329
Author:
Robert L. Sexton
Publisher:
SAGE Publications, Inc

Brief Principles of Macroeconomics (MindTap Cours…
Economics
ISBN:
9781337091985
Author:
N. Gregory Mankiw
Publisher:
Cengage Learning

Essentials of Economics (MindTap Course List)
Economics
ISBN:
9781337091992
Author:
N. Gregory Mankiw
Publisher:
Cengage Learning
Exploring Economics
Economics
ISBN:
9781544336329
Author:
Robert L. Sexton
Publisher:
SAGE Publications, Inc
Brief Principles of Macroeconomics (MindTap Cours…
Economics
ISBN:
9781337091985
Author:
N. Gregory Mankiw
Publisher:
Cengage Learning
Essentials of Economics (MindTap Course List)
Economics
ISBN:
9781337091992
Author:
N. Gregory Mankiw
Publisher:
Cengage Learning


Economics Today and Tomorrow, Student Edition
Economics
ISBN:
9780078747663
Author:
McGraw-Hill
Publisher:
Glencoe/McGraw-Hill School Pub Co

Principles of Microeconomics (MindTap Course List)
Economics
ISBN:
9781305971493
Author:
N. Gregory Mankiw
Publisher:
Cengage Learning