Use the following data to draw the supply and demand curves on the accompanying graph. Price $8 $7 $6 $5 $4 $3 $2 $1 Quantity demanded 4 7 8 10 Quantity supplied 9. 8 7 4 3 2 Instructions: Use the 'Supply' and 'Demand' tools to draw the supply and demand curves using the data in the table above. Inc each price-quantity combination (plot 8 points total for each line).
Use the following data to draw the supply and demand curves on the accompanying graph. Price $8 $7 $6 $5 $4 $3 $2 $1 Quantity demanded 4 7 8 10 Quantity supplied 9. 8 7 4 3 2 Instructions: Use the 'Supply' and 'Demand' tools to draw the supply and demand curves using the data in the table above. Inc each price-quantity combination (plot 8 points total for each line).

Chapter5: Supply, Demand, And Price: Applications
Section: Chapter Questions
Problem 5WNG

Related questions
Question
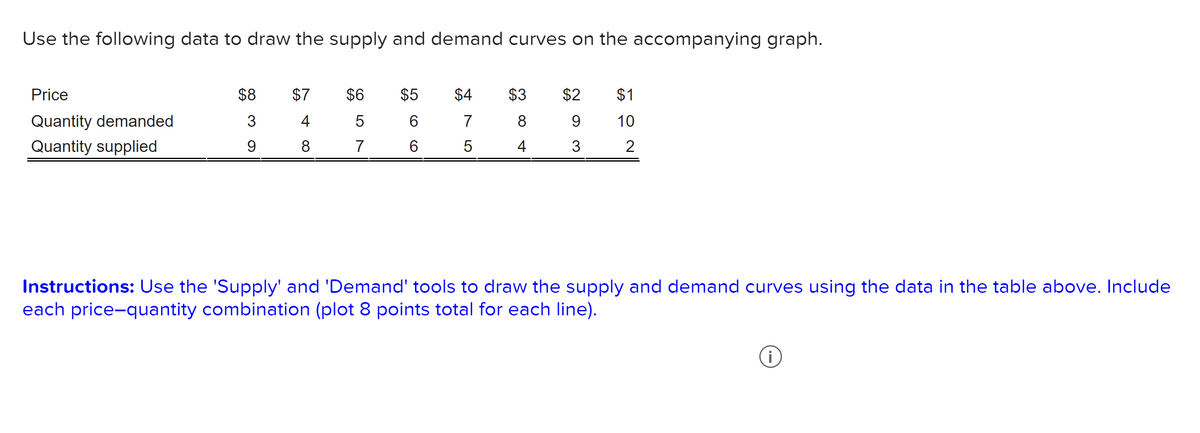
Transcribed Image Text:Use the following data to draw the supply and demand curves on the accompanying graph.
Price
$8
$7
$6
$5
$4
$3
$2
$1
Quantity demanded
3
4
7
8
9
10
Quantity supplied
9.
8
7
6.
5
4
3
2
Instructions: Use the 'Supply' and 'Demand' tools to draw the supply and demand curves using the data in the table above. Include
each price-quantity combination (plot 8 points total for each line).
i
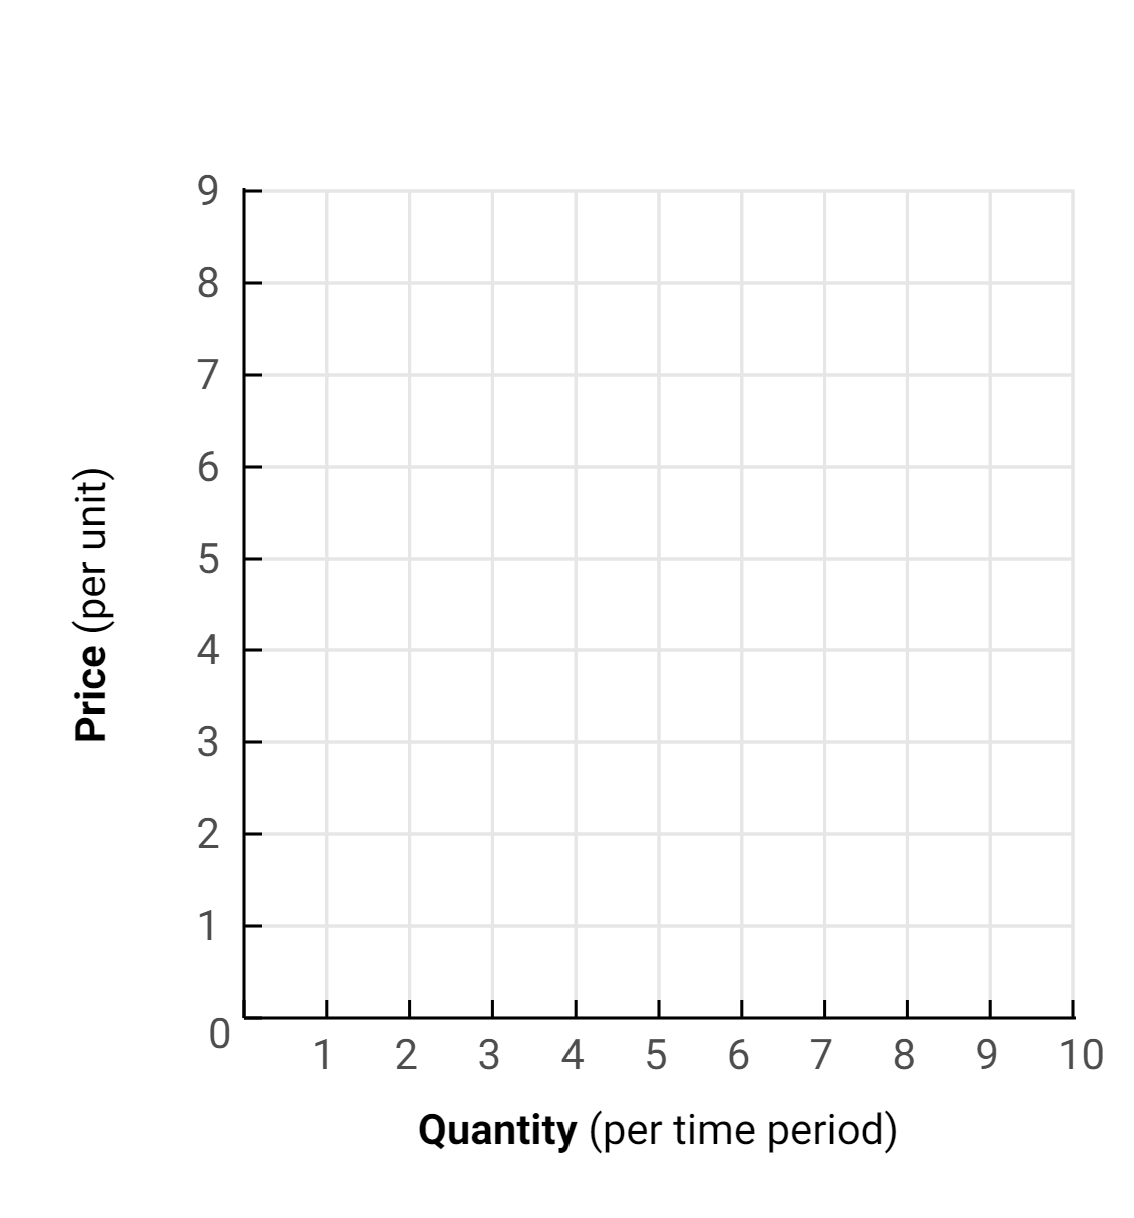
Transcribed Image Text:9
8
7
б
4
2
1
1
2
3
4
6.
7
8
9.
10
Quantity (per time period)
Price (per unit)
Expert Solution
Step 1
Demand curve represents quantity demanded at different prices, its slopes downward. Supply curve represents quantity supplied at different prices, it slopes upward.

Trending now
This is a popular solution!

Step by step
Solved in 2 steps with 1 images

Knowledge Booster


Learn more about
Need a deep-dive on the concept behind this application? Look no further. Learn more about this topic, economics and related others by exploring similar questions and additional content below.Recommended textbooks for you

Economics (MindTap Course List)
Economics
ISBN:
9781337617383
Author:
Roger A. Arnold
Publisher:
Cengage Learning

Economics (MindTap Course List)
Economics
ISBN:
9781337617383
Author:
Roger A. Arnold
Publisher:
Cengage Learning

Microeconomics: Principles & Policy
Economics
ISBN:
9781337794992
Author:
William J. Baumol, Alan S. Blinder, John L. Solow
Publisher:
Cengage Learning


Managerial Economics: A Problem Solving Approach
Economics
ISBN:
9781337106665
Author:
Luke M. Froeb, Brian T. McCann, Michael R. Ward, Mike Shor
Publisher:
Cengage Learning