Problem #1 - Freeze Inc. is an air conditioning company located in Lakeland, Florida. They collected data for the number of air conditioning units sold in the Central Florida area and for the outside temperature on the day that sales took place. The Sales Manager put the following table together: Outside Temperature Sales (Degrees F) (Number of air conditioning units sold) 68 72
Problem #1 - Freeze Inc. is an air conditioning company located in Lakeland, Florida. They collected data for the number of air conditioning units sold in the Central Florida area and for the outside temperature on the day that sales took place. The Sales Manager put the following table together: Outside Temperature Sales (Degrees F) (Number of air conditioning units sold) 68 72

MATLAB: An Introduction with Applications
6th Edition
ISBN:9781119256830
Author:Amos Gilat
Publisher:Amos Gilat
Chapter1: Starting With Matlab
Section: Chapter Questions
Problem 1P

Related questions
Question
100%
Questions A, B, C please
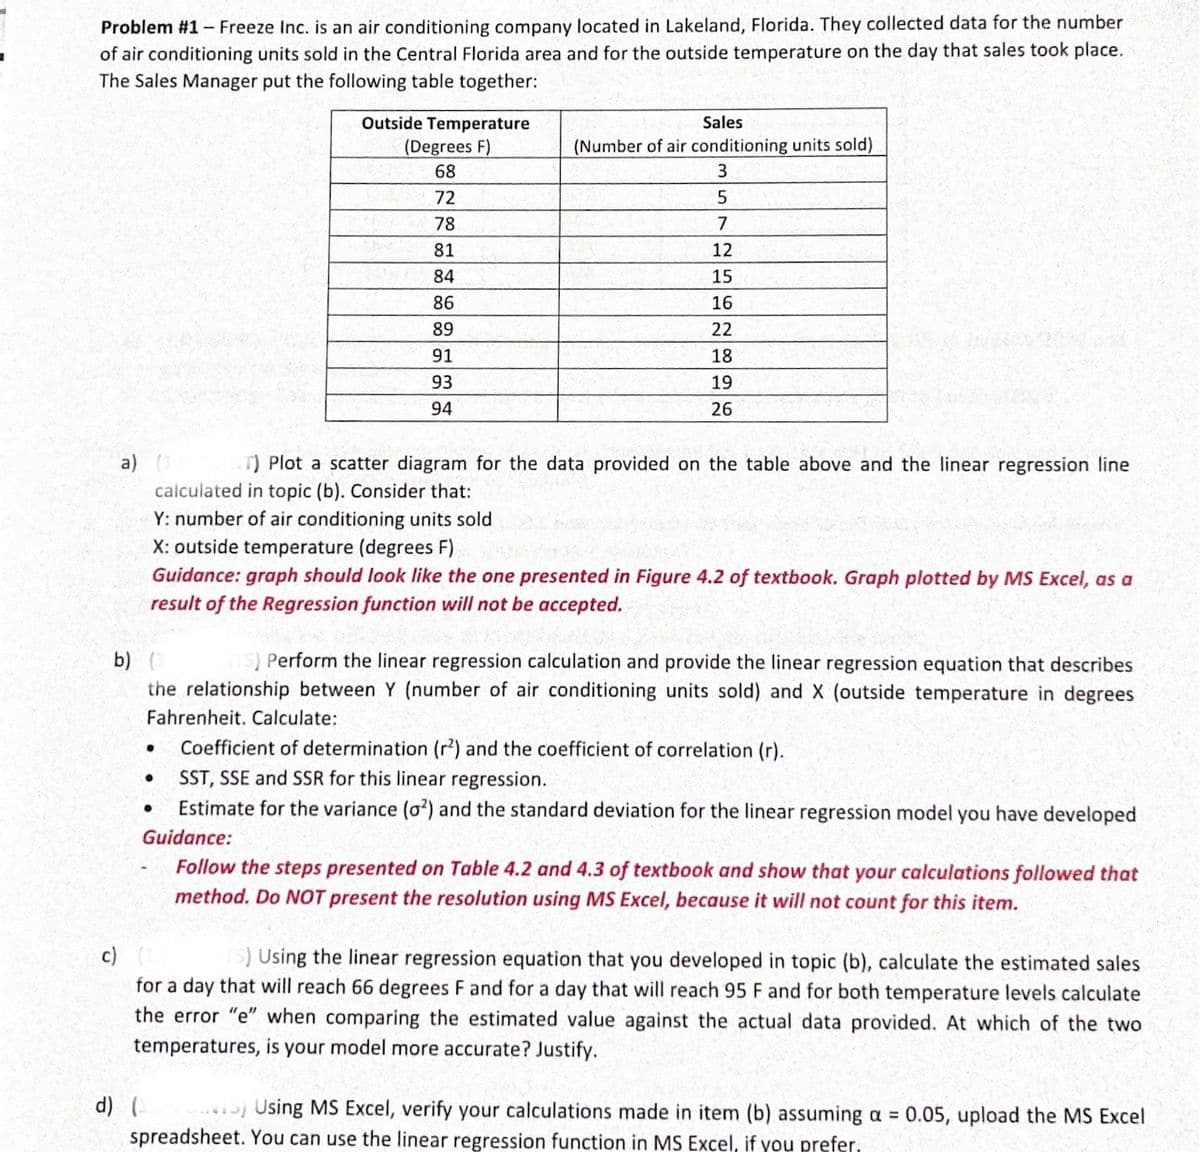
Transcribed Image Text:Problem #1 - Freeze Inc. is an air conditioning company located in Lakeland, Florida. They collected data for the number
of air conditioning units sold in the Central Florida area and for the outside temperature on the day that sales took place.
The Sales Manager put the following table together:
Outside Temperature
Sales
(Degrees F)
(Number of air conditioning units sold)
68
72
78
7.
81
12
84
15
86
16
89
22
91
18
93
19
94
26
a) (1
calculated in topic (b). Consider that:
Y: number of air conditioning units sold
X: outside temperature (degrees F)
Guidance: graph should look like the one presented in Figure 4.2 of textbook. Graph plotted by MS Excel, as a
result of the Regression function will not be accepted.
T) Plot a scatter diagram for the data provided on the table above and the linear regression line
b) (
the relationship between Y (number of air conditioning units sold) and X (outside temperature in degrees
Perform the linear regression calculation and provide the linear regression equation that describes
Fahrenheit. Calculate:
Coefficient of determination (r?) and the coefficient of correlation (r).
SST, SSE and SSR for this linear regression.
Estimate for the variance (o?) and the standard deviation for the linear regression model you have developed
Guidance:
Follow the steps presented on Table 4.2 and 4.3 of textbook and show that your calculations followed that
method. Do NOT present the resolution using MS Excel, because it will not count for this item.
S) Using the linear regression equation that you developed in topic (b), calculate the estimated sales
for a day that will reach 66 degrees F and for a day that will reach 95 F and for both temperature levels calculate
the error "e" when comparing the estimated value against the actual data provided. At which of the two
temperatures, is your model more accurate? Justify.
...S) Using MS Excel, verify your calculations made in item (b) assuming a 0.05, upload the MS Excel
d) (-
spreadsheet. You can use the linear regression function in MS Excel, if you prefer.
Expert Solution
This question has been solved!
Explore an expertly crafted, step-by-step solution for a thorough understanding of key concepts.

This is a popular solution!

Trending now
This is a popular solution!

Step by step
Solved in 2 steps with 2 images

Recommended textbooks for you
MATLAB: An Introduction with Applications
Statistics
ISBN:
9781119256830
Author:
Amos Gilat
Publisher:
John Wiley & Sons Inc

Probability and Statistics for Engineering and th…
Statistics
ISBN:
9781305251809
Author:
Jay L. Devore
Publisher:
Cengage Learning

Statistics for The Behavioral Sciences (MindTap C…
Statistics
ISBN:
9781305504912
Author:
Frederick J Gravetter, Larry B. Wallnau
Publisher:
Cengage Learning
MATLAB: An Introduction with Applications
Statistics
ISBN:
9781119256830
Author:
Amos Gilat
Publisher:
John Wiley & Sons Inc
Probability and Statistics for Engineering and th…
Statistics
ISBN:
9781305251809
Author:
Jay L. Devore
Publisher:
Cengage Learning
Statistics for The Behavioral Sciences (MindTap C…
Statistics
ISBN:
9781305504912
Author:
Frederick J Gravetter, Larry B. Wallnau
Publisher:
Cengage Learning

Elementary Statistics: Picturing the World (7th E…
Statistics
ISBN:
9780134683416
Author:
Ron Larson, Betsy Farber
Publisher:
PEARSON

The Basic Practice of Statistics
Statistics
ISBN:
9781319042578
Author:
David S. Moore, William I. Notz, Michael A. Fligner
Publisher:
W. H. Freeman

Introduction to the Practice of Statistics
Statistics
ISBN:
9781319013387
Author:
David S. Moore, George P. McCabe, Bruce A. Craig
Publisher:
W. H. Freeman