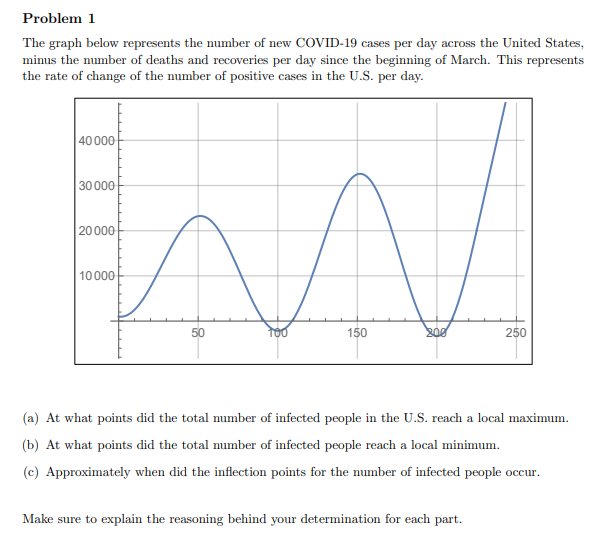
Problem 1 The graph below represents the number of new COVID-19 cases per day across the United States, minus the number of deaths and recoveries per day since the beginning of March. This represents the rate of change of the number of positive cases in the U.S. per day. 40000 30000 20000 10000 50 150 250 (a) At what points did the total mumber of infected people in the U.S. reach a local maximum. (b) At what points did the total number of infected people reach a local minimum. (c) Approximately when did the inflection points for the number of infected people occur.


Unitary Method
The word “unitary” comes from the word “unit”, which means a single and complete entity. In this method, we find the value of a unit product from the given number of products, and then we solve for the other number of products.
Speed, Time, and Distance
Imagine you and 3 of your friends are planning to go to the playground at 6 in the evening. Your house is one mile away from the playground and one of your friends named Jim must start at 5 pm to reach the playground by walk. The other two friends are 3 miles away.
Profit and Loss
The amount earned or lost on the sale of one or more items is referred to as the profit or loss on that item.
Units and Measurements
Measurements and comparisons are the foundation of science and engineering. We, therefore, need rules that tell us how things are measured and compared. For these measurements and comparisons, we perform certain experiments, and we will need the experiments to set up the devices.


Trending now
This is a popular solution!

Step by step
Solved in 3 steps with 1 images


