Problem 1. One study on the effects of cannabis used rats as test organisms; data in the table below describe the weight (g) of livers harvested from some of the test rats. 13.47, 12.19, 6.35, 12.62, 6.8, 6.78, 6.62, 10.3, 10.21, 8.47, 5.56,9.83 7.62, 4, 9.82, 5.2, 8.61, 11.7, 9.76, 12.16, 7.87, 7.16, 12.31, 16.9,6.72 Use these data to answer the following questions. a) Fill in the missing sample statistics in the table; enter values to three decimal places. Statistic Value Statistic Value Sample size Estimated standard deviation Minimum Estimated variance Maximum Estimated skewness Mean Estimated kurtosis b) Create a boxplot of the data, and include that figure as part of your solution. How many outliers do you think there are in this dataset? c) Create a histogram of the data, and include that figure as part of your solution. What parametric distribution do you think is appropriate for the data? d) Createa quantile-quantile plotofthedatashowing the sample quantiles asa function ofthe theoretical quantiles of a normal distribution. Include a theoretical ideal fit reference line. Include that figure as part of your solution. Do the data appear to fit a normal distribution? Assume you elected to model the data using a normal distribution: e) What parameter values would you recommend for that model? f) What are the estimated standard errors of those parameters? The following questions are based on the assumption that a normal distribution is an appropriate model. g) What are the lower and upper limits of an 85% confidence interval on the mean? h) What are the lower and upper limits of an 85% confidence interval onthe standard deviation? i) What are the lower and upper limits of an 85% confidence interval on a prediction for the next sample drawn?
Problem 1. One study on the effects of cannabis used rats as test organisms; data in the table below describe the weight (g) of livers harvested from some of the test rats. 13.47, 12.19, 6.35, 12.62, 6.8, 6.78, 6.62, 10.3, 10.21, 8.47, 5.56,9.83 7.62, 4, 9.82, 5.2, 8.61, 11.7, 9.76, 12.16, 7.87, 7.16, 12.31, 16.9,6.72 Use these data to answer the following questions. a) Fill in the missing sample statistics in the table; enter values to three decimal places. Statistic Value Statistic Value Sample size Estimated standard deviation Minimum Estimated variance Maximum Estimated skewness Mean Estimated kurtosis b) Create a boxplot of the data, and include that figure as part of your solution. How many outliers do you think there are in this dataset? c) Create a histogram of the data, and include that figure as part of your solution. What parametric distribution do you think is appropriate for the data? d) Createa quantile-quantile plotofthedatashowing the sample quantiles asa function ofthe theoretical quantiles of a normal distribution. Include a theoretical ideal fit reference line. Include that figure as part of your solution. Do the data appear to fit a normal distribution? Assume you elected to model the data using a normal distribution: e) What parameter values would you recommend for that model? f) What are the estimated standard errors of those parameters? The following questions are based on the assumption that a normal distribution is an appropriate model. g) What are the lower and upper limits of an 85% confidence interval on the mean? h) What are the lower and upper limits of an 85% confidence interval onthe standard deviation? i) What are the lower and upper limits of an 85% confidence interval on a prediction for the next sample drawn?

MATLAB: An Introduction with Applications
6th Edition
ISBN:9781119256830
Author:Amos Gilat
Publisher:Amos Gilat
Chapter1: Starting With Matlab
Section: Chapter Questions
Problem 1P

Related questions
Question
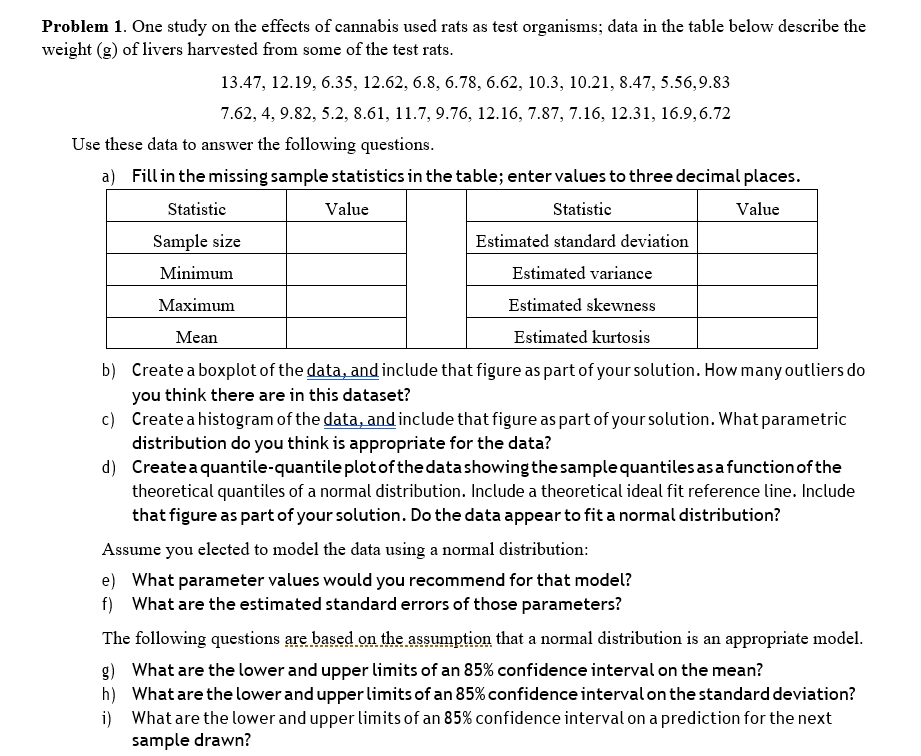
Transcribed Image Text:Problem 1. One study on the effects of cannabis used rats as test organisms; data in the table below describe the
weight (g) of livers harvested from some of the test rats.
13.47, 12.19, 6.35, 12.62, 6.8, 6.78, 6.62, 10.3, 10.21, 8.47, 5.56,9.83
7.62, 4, 9.82, 5.2, 8.61, 11.7, 9.76, 12.16, 7.87, 7.16, 12.31, 16.9,6.72
Use these data to answer the following questions.
a) Fill in the missing sample statistics in the table; enter values to three decimal places.
Statistic
Value
Statistic
Value
Sample size
Estimated standard deviation
Minimum
Estimated variance
Maximum
Estimated skewness
Mean
Estimated kurtosis
b) Create a boxplot of the data, and include that figure as part of your solution. How many outliers do
you
think there are in this dataset?
c) Create a histogram of the data, and include that figure as part of your solution. What parametric
distribution do you think is appropriate for the data?
d) Createa quantile-quantile plotofthedatashowing the sample quantiles asa function ofthe
theoretical quantiles of a normal distribution. Include a theoretical ideal fit reference line. Include
that figure as part of your solution. Do the data appear to fit a normal distribution?
Assume you elected to model the data using a normal distribution:
e) What parameter values would you recommend for that model?
f) What are the estimated standard errors of those parameters?
The following questions are based on the assumption that a normal distribution is an appropriate model.
g) What are the lower and upper limits of an 85% confidence interval on the mean?
h) What are the lower and upper limits of an 85% confidence interval onthe standard deviation?
i) What are the lower and upper limits of an 85% confidence interval on a prediction for the next
sample drawn?
Expert Solution
This question has been solved!
Explore an expertly crafted, step-by-step solution for a thorough understanding of key concepts.

Step by step
Solved in 4 steps with 4 images

Recommended textbooks for you
MATLAB: An Introduction with Applications
Statistics
ISBN:
9781119256830
Author:
Amos Gilat
Publisher:
John Wiley & Sons Inc

Probability and Statistics for Engineering and th…
Statistics
ISBN:
9781305251809
Author:
Jay L. Devore
Publisher:
Cengage Learning

Statistics for The Behavioral Sciences (MindTap C…
Statistics
ISBN:
9781305504912
Author:
Frederick J Gravetter, Larry B. Wallnau
Publisher:
Cengage Learning
MATLAB: An Introduction with Applications
Statistics
ISBN:
9781119256830
Author:
Amos Gilat
Publisher:
John Wiley & Sons Inc
Probability and Statistics for Engineering and th…
Statistics
ISBN:
9781305251809
Author:
Jay L. Devore
Publisher:
Cengage Learning
Statistics for The Behavioral Sciences (MindTap C…
Statistics
ISBN:
9781305504912
Author:
Frederick J Gravetter, Larry B. Wallnau
Publisher:
Cengage Learning

Elementary Statistics: Picturing the World (7th E…
Statistics
ISBN:
9780134683416
Author:
Ron Larson, Betsy Farber
Publisher:
PEARSON

The Basic Practice of Statistics
Statistics
ISBN:
9781319042578
Author:
David S. Moore, William I. Notz, Michael A. Fligner
Publisher:
W. H. Freeman

Introduction to the Practice of Statistics
Statistics
ISBN:
9781319013387
Author:
David S. Moore, George P. McCabe, Bruce A. Craig
Publisher:
W. H. Freeman