Problem 17-2A Part 2 2. Complete the below table to calculate income statement data in common-size percents. (Round your percentage answers to 2 decimal places.) KORBIN COMPANY Common-Size Comparative Income Statements For Years Ended December 31, 2017, 2016, and 2015 2017 2016 2015 Sales 100.00 % 100.00 % 100.00 % Cost of goods sold Gross profit Selling expenses Administrative expenses Total exnenses
Problem 17-2A Part 2 2. Complete the below table to calculate income statement data in common-size percents. (Round your percentage answers to 2 decimal places.) KORBIN COMPANY Common-Size Comparative Income Statements For Years Ended December 31, 2017, 2016, and 2015 2017 2016 2015 Sales 100.00 % 100.00 % 100.00 % Cost of goods sold Gross profit Selling expenses Administrative expenses Total exnenses

Survey of Accounting (Accounting I)
8th Edition
ISBN:9781305961883
Author:Carl Warren
Publisher:Carl Warren
Chapter4: Accounting For Retail Operations
Section: Chapter Questions
Problem 4.2MBA: Sales transactions Using transactions listed in P4-2, indicate the effects of each transaction on...

Related questions
Question
100%
![Problem 17-2A Ratios, common-size statements, and trend percents LO P1, P2, P3
[The following information applies to the questions displayed below.]
Selected comparative financial statements of Korbin Company follow:
KORBIN COMPANY
Comparative Income Statements
For Years Ended December 31, 2017, 2016, and 2015
2017
2016
2015
$ 396,891
238,928
157,963
56,359
$ 304,051
191,248
112,803
41,959
26,756
$ 211,000
135,040
75,960
27,852
Sales
Cost of goods sold
Gross profit
Selling expenses
Administrative expenses
35,720
92,079
65,884
12,254
17,513
45,365
30,595
Total expenses
68,715
44,088
9,038
Income before taxes
Income taxes
6,211
Net income
$ 53,630
$ 35,050
$
24,384
KORBIΝ COMPΑNY
Comparative Balance Sheets
December 31, 2017, 2016, and 2015
2017
2016
2015
Assets
$ 49,213
$
38,503
1,200
95,481
Current assets
$
51,470
Long-term investments
4,100
90,003
$ 139,216
56,430
$ 112,000
Plant assets, net
Total assets
$ 135,184
Liabilities and Equity
$ 20,326
67,000
8,375
43,515
20,142
67,000
8,375
39,667
Current liabilities
$
$
19,600
49,000
5,444
Common stock
Other paid-in capital
Retained earnings
37,956
Total liabilities and equity
$ 139,216
$ 135,184
$ 112,000](/v2/_next/image?url=https%3A%2F%2Fcontent.bartleby.com%2Fqna-images%2Fquestion%2Fb7efdc13-0dc0-4f4b-a7af-1a61d8f2354f%2Fbf19f13e-aa72-437f-8bce-f58d974c75c8%2Fh3of4rs_processed.png&w=3840&q=75)
Transcribed Image Text:Problem 17-2A Ratios, common-size statements, and trend percents LO P1, P2, P3
[The following information applies to the questions displayed below.]
Selected comparative financial statements of Korbin Company follow:
KORBIN COMPANY
Comparative Income Statements
For Years Ended December 31, 2017, 2016, and 2015
2017
2016
2015
$ 396,891
238,928
157,963
56,359
$ 304,051
191,248
112,803
41,959
26,756
$ 211,000
135,040
75,960
27,852
Sales
Cost of goods sold
Gross profit
Selling expenses
Administrative expenses
35,720
92,079
65,884
12,254
17,513
45,365
30,595
Total expenses
68,715
44,088
9,038
Income before taxes
Income taxes
6,211
Net income
$ 53,630
$ 35,050
$
24,384
KORBIΝ COMPΑNY
Comparative Balance Sheets
December 31, 2017, 2016, and 2015
2017
2016
2015
Assets
$ 49,213
$
38,503
1,200
95,481
Current assets
$
51,470
Long-term investments
4,100
90,003
$ 139,216
56,430
$ 112,000
Plant assets, net
Total assets
$ 135,184
Liabilities and Equity
$ 20,326
67,000
8,375
43,515
20,142
67,000
8,375
39,667
Current liabilities
$
$
19,600
49,000
5,444
Common stock
Other paid-in capital
Retained earnings
37,956
Total liabilities and equity
$ 139,216
$ 135,184
$ 112,000
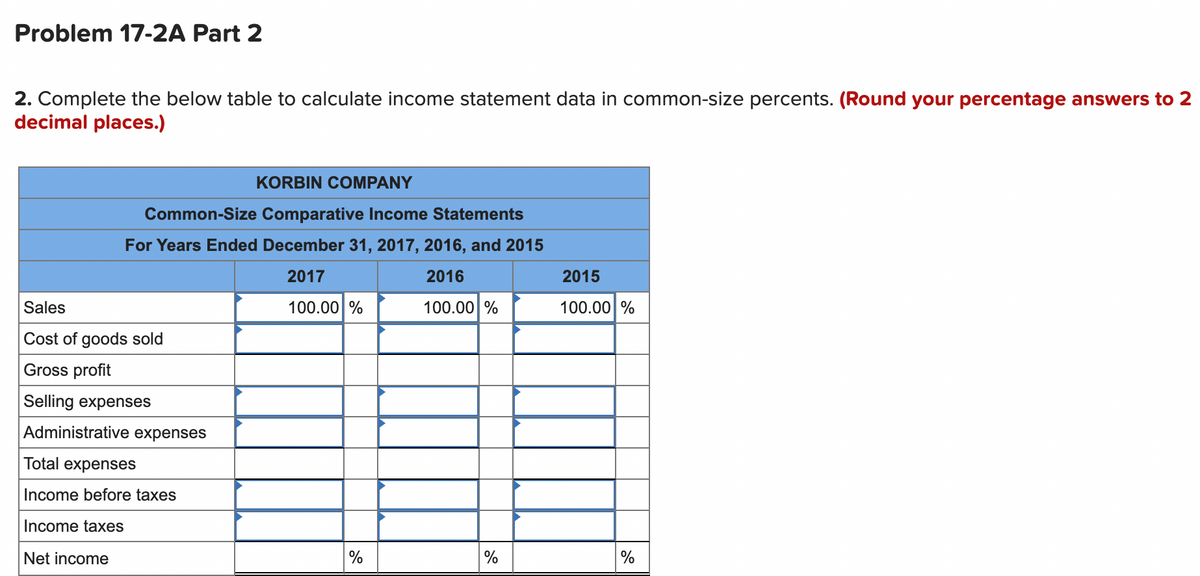
Transcribed Image Text:Problem 17-2A Part 2
2. Complete the below table to calculate income statement data in common-size percents. (Round your percentage answers to 2
decimal places.)
KORBIN COMPANY
Common-Size Comparative Income Statements
For Years Ended December 31, 2017, 2016, and 2015
2017
2016
2015
Sales
100.00 %
100.00 %
100.00 %
Cost of goods sold
Gross profit
Selling expenses
Administrative expenses
Total expenses
Income before taxes
Income taxes
Net income
%
Expert Solution
This question has been solved!
Explore an expertly crafted, step-by-step solution for a thorough understanding of key concepts.

This is a popular solution!

Trending now
This is a popular solution!

Step by step
Solved in 2 steps with 1 images

Knowledge Booster


Learn more about
Need a deep-dive on the concept behind this application? Look no further. Learn more about this topic, accounting and related others by exploring similar questions and additional content below.Recommended textbooks for you
Survey of Accounting (Accounting I)
Accounting
ISBN:
9781305961883
Author:
Carl Warren
Publisher:
Cengage Learning

Accounting (Text Only)
Accounting
ISBN:
9781285743615
Author:
Carl Warren, James M. Reeve, Jonathan Duchac
Publisher:
Cengage Learning

Financial & Managerial Accounting
Accounting
ISBN:
9781285866307
Author:
Carl Warren, James M. Reeve, Jonathan Duchac
Publisher:
Cengage Learning
Survey of Accounting (Accounting I)
Accounting
ISBN:
9781305961883
Author:
Carl Warren
Publisher:
Cengage Learning
Accounting (Text Only)
Accounting
ISBN:
9781285743615
Author:
Carl Warren, James M. Reeve, Jonathan Duchac
Publisher:
Cengage Learning
Financial & Managerial Accounting
Accounting
ISBN:
9781285866307
Author:
Carl Warren, James M. Reeve, Jonathan Duchac
Publisher:
Cengage Learning

Accounting
Accounting
ISBN:
9781337272094
Author:
WARREN, Carl S., Reeve, James M., Duchac, Jonathan E.
Publisher:
Cengage Learning,