Accounting (Text Only)
26th Edition
ISBN: 9781285743615
Author: Carl Warren, James M. Reeve, Jonathan Duchac
Publisher: Cengage Learning
expand_more
expand_more
format_list_bulleted
Videos
Textbook Question
Chapter 17, Problem 17.17EX
Profitability ratios
The following selected data were taken from the financial statements of Robinson Inc. for December 31, 2016, 2015 and 2014:
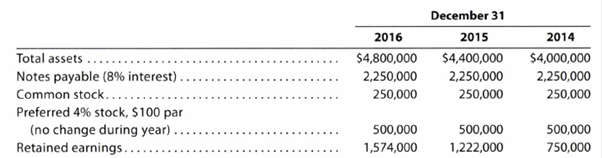
The 2016 net income was $372,000, and the 2015 net income was $492,000. No dividends on common stock were declared between 2014 and 2016.
a. Determine the rate earned on total assets, the rate earned on stockholders’ equity, and the rate earned on common stockholders’ equity for the years 2015 and 2016. Round to one decimal place.
b. What conclusions can be drawn from these data as to the company’s profitability?
Expert Solution & Answer
Want to see the full answer?
Check out a sample textbook solution
Chapter 17 Solutions
Accounting (Text Only)
Ch. 17 - Prob. 1DQCh. 17 - Prob. 2DQCh. 17 - Prob. 3DQCh. 17 - How would the current and quick ratios of a...Ch. 17 - a. Why is it advantageous to have a high inventory...Ch. 17 - What do the following data, taken from a...Ch. 17 - a. How does the rate earned on total assets differ...Ch. 17 - Kroger, a grocery store, recently had a...Ch. 17 - Prob. 9DQCh. 17 - Prob. 10DQ
Ch. 17 - Horizontal analysis The comparative temporary...Ch. 17 - Prob. 17.1BPECh. 17 - Vertical analysis Income statement information for...Ch. 17 - Vertical analysis Income statement information for...Ch. 17 - Prob. 17.3APECh. 17 - Prob. 17.3BPECh. 17 - Accounts receivable analysis A company reports the...Ch. 17 - Accounts receivable analysis A company reports the...Ch. 17 - Inventory analysis A company reports the...Ch. 17 - Inventory analysis A company reports the...Ch. 17 - Prob. 17.6APECh. 17 - Prob. 17.6BPECh. 17 - Times interest earned A company reports the...Ch. 17 - Times interest earned A company reports the...Ch. 17 - Asset turnover A company reports the following:...Ch. 17 - Asset turnover A company reports the following:...Ch. 17 - Return on total assets A company reports the...Ch. 17 - Return on total assets A company reports the...Ch. 17 - Common stockholders profitability analysis A...Ch. 17 - Common stockholders profitability analysis A...Ch. 17 - Prob. 17.11APECh. 17 - Prob. 17.11BPECh. 17 - Prob. 17.1EXCh. 17 - Vertical analysis of income statement The...Ch. 17 - Common-sized income statement Revenue and expense...Ch. 17 - Vertical analysis of balance sheet Balance sheet...Ch. 17 - Prob. 17.5EXCh. 17 - Prob. 17.6EXCh. 17 - Prob. 17.7EXCh. 17 - Prob. 17.8EXCh. 17 - Accounts receivable analysis The following data...Ch. 17 - Accounts receivable analysis Xavier Scores Company...Ch. 17 - Inventory analysis The following data were...Ch. 17 - Prob. 17.12EXCh. 17 - Ratio of liabilities to stockholders equity and...Ch. 17 - Ratio of liabilities to stockholders equity and...Ch. 17 - Ratio of liabilities to stockholders equity and...Ch. 17 - Prob. 17.16EXCh. 17 - Profitability ratios The following selected data...Ch. 17 - Profitability ratios Ralph Lauren Corporation...Ch. 17 - Six measures of solvency or profitability The...Ch. 17 - Six measures of solvency or profitability The...Ch. 17 - Prob. 17.21EXCh. 17 - Prob. 17.22EXCh. 17 - Earnings per share, discontinued operations The...Ch. 17 - Prob. 17.24EXCh. 17 - Prob. 17.25EXCh. 17 - Prob. 17.26EXCh. 17 - Horizontal analysis of income statement For 2016,...Ch. 17 - Prob. 17.2APRCh. 17 - Prob. 17.3APRCh. 17 - Nineteen measures of solvency and profitability...Ch. 17 - Prob. 17.5APRCh. 17 - Prob. 17.1BPRCh. 17 - Prob. 17.2BPRCh. 17 - Effect of transactions on current position...Ch. 17 - Nineteen measures of solvency and profitability...Ch. 17 - Solvency and profitability trend analysis Crosby...Ch. 17 - Nike, Inc., Problem Financial Statement Analysis...Ch. 17 - Prob. 17.1CPCh. 17 - Prob. 17.2CPCh. 17 - Vertical analysis The condensed income statements...Ch. 17 - Prob. 17.4CPCh. 17 - Comprehensive profitability and solvency analysis...
Knowledge Booster


Learn more about
Need a deep-dive on the concept behind this application? Look no further. Learn more about this topic, accounting and related others by exploring similar questions and additional content below.Similar questions
- Financial statement data for years ending December 31 for Latchkey Company follows: a. Determine the ratio of sales to assets for 2016 and 2015. b. Does the change in the ratio of sales to assets from 2015 to 2016 indicate a favorable or an unfavorable trend?arrow_forwardFinancial statement analysis The financial statements for Nike, Inc., are presented in Appendix D at the end of the text. Use the following additional information (in thousands): Instructions 1. Determine the following measures for the fiscal years ended May 31, 2016, and May 31, 2015. Round ratios and percentages to one decimal place. a. Working capital b. Current ratio c. Quick ratio d. Accounts receivable turnover e. Number of days sales in receivables f. Inventory turnover g. Number of days sales in inventory h. Ratio of liabilities to stockholders equity i. Asset turnover j. Return on total assets. k. Return on common stockholders equity l. Price-earnings ratio, assuming that the market price was 54.90 per share on May 29, 2016, and 52.81 per share on May 30, 2015 m. Percentage relationship of net income to sales 2. What conclusions can be drawn from these analyses?arrow_forwardMeasures of liquidity, solvency, and profitability The comparative financial statements of Marshall Inc. are as follows. The market price of Marshall common stock was 82.60 on December 31, 20Y2. Instructions Determine the following measures for 20Y2, rounding to one decimal place, including percentages, except for per-share amounts: 1. Working capital 2. Current ratio 3. Quick ratio 4. Accounts receivable turnover 5. Number of days sales in receivables 6. Inventory turnover 7. Number of days sales in inventory 8. Ratio of fixed assets to long-term liabilities 9. Ratio of liabilities to stockholders equity 10. Times interest earned 11. Asset turnover 12. Return on total assets 13. Return on stockholders equity 14. Return on common stockholders equity 15. Earnings per share on common stock 16. Price-earnings ratio 17. Dividends per share of common stock 18. Dividend yieldarrow_forward
arrow_back_ios
arrow_forward_ios
Recommended textbooks for you
 Financial AccountingAccountingISBN:9781305088436Author:Carl Warren, Jim Reeve, Jonathan DuchacPublisher:Cengage Learning
 Cornerstones of Financial AccountingAccountingISBN:9781337690881Author:Jay Rich, Jeff JonesPublisher:Cengage Learning
 Financial Accounting: The Impact on Decision Make...AccountingISBN:9781305654174Author:Gary A. Porter, Curtis L. NortonPublisher:Cengage Learning
 Financial AccountingAccountingISBN:9781337272124Author:Carl Warren, James M. Reeve, Jonathan DuchacPublisher:Cengage Learning
 Managerial AccountingAccountingISBN:9781337912020Author:Carl Warren, Ph.d. Cma William B. TaylerPublisher:South-Western College Pub
Financial Accounting
Accounting
ISBN:9781305088436
Author:Carl Warren, Jim Reeve, Jonathan Duchac
Publisher:Cengage Learning
Cornerstones of Financial Accounting
Accounting
ISBN:9781337690881
Author:Jay Rich, Jeff Jones
Publisher:Cengage Learning
Financial Accounting: The Impact on Decision Make...
Accounting
ISBN:9781305654174
Author:Gary A. Porter, Curtis L. Norton
Publisher:Cengage Learning
Financial Accounting
Accounting
ISBN:9781337272124
Author:Carl Warren, James M. Reeve, Jonathan Duchac
Publisher:Cengage Learning
Managerial Accounting
Accounting
ISBN:9781337912020
Author:Carl Warren, Ph.d. Cma William B. Tayler
Publisher:South-Western College Pub
Financial ratio analysis; Author: The Finance Storyteller;https://www.youtube.com/watch?v=MTq7HuvoGck;License: Standard Youtube License