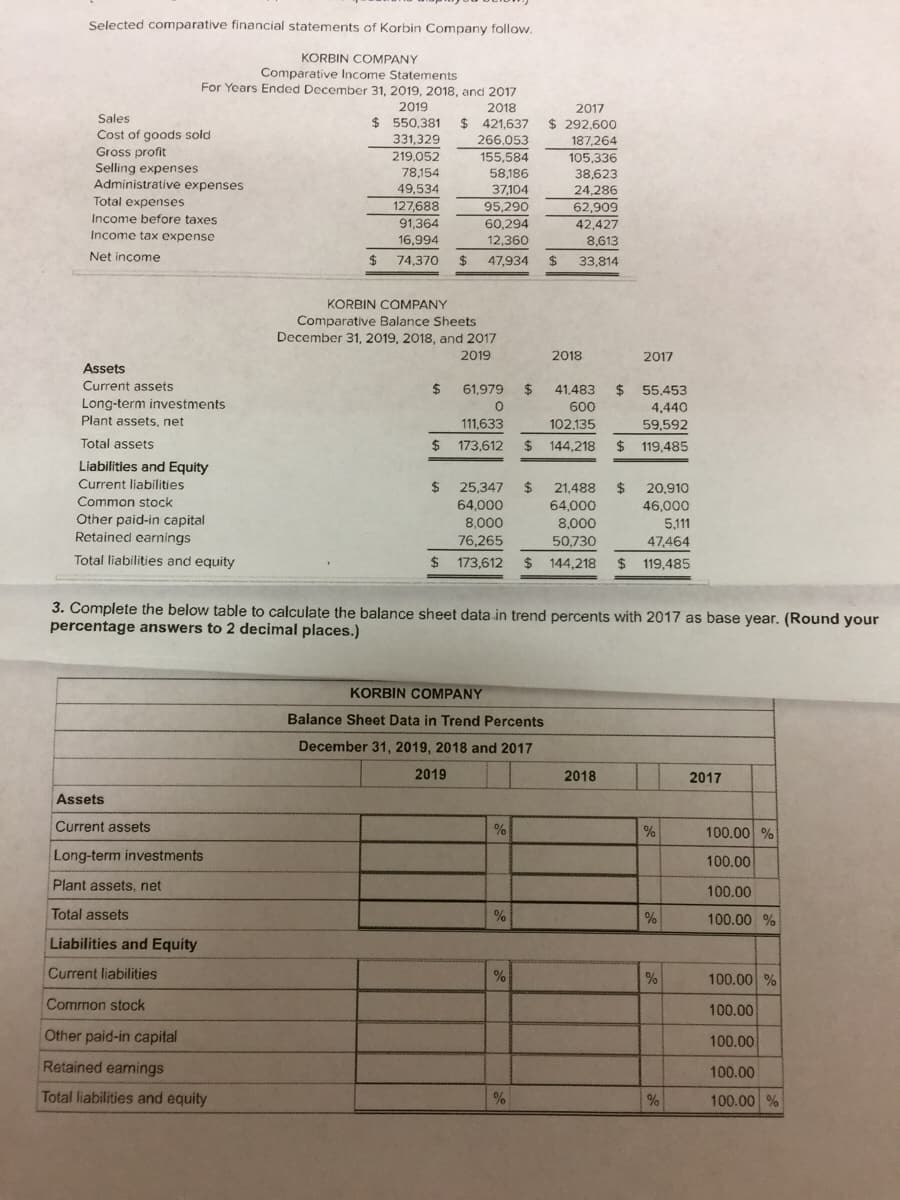
Selected comparative financial statements of Korbin Company follow. KORBIN COMPANY Comparative Income Statements For Years Ended December 31, 2019, 2018, and 2017 2019 2018 2017 Sales $ 550,381 $ 421,637 $ 292,600 Cost of goods sold Gross profit Selling expenses Administrative expenses 331,329 266,053 187,264 219,052 105,336 155,584 58,186 78,154 38,623 24,286 49,534 127,688 91,364 37,104 Total expenses Income before taxes 95,290 62,909 60,294 12,360 42,427 Income tax expense 16,994 8,613 Net income 24 74,370 24 47,934 2$ 33,814 KORBIN COMPANY Comparative Balance Sheets December 31, 2019, 2018, and 2017 2019 2018 2017 Assets Current assets $ 61,979 2$ $ 55,453 4,440 41,483 Long-term investments Plant assets, net 600 111,633 102,135 59,592 $ 19,485 Total assetsS $ 173,612 $ 144,218 Liabilitles and Equity Current liabilities Common stock Other paid-in capital Retained earnings 2$ 24 64,000 25,347 21,488 2$ 20,910 64,000 8,000 46,000 5,111 47,464 8,000 76,265 $ 173,612 50,730 Total liabilities and equity $ 144,218 $ 119,485 3. Complete the below table to calculate the balance sheet data in trend percents with 2017 as base year. (Round your percentage answers to 2 decimal places.)
Selected comparative financial statements of Korbin Company follow. KORBIN COMPANY Comparative Income Statements For Years Ended December 31, 2019, 2018, and 2017 2019 2018 2017 Sales $ 550,381 $ 421,637 $ 292,600 Cost of goods sold Gross profit Selling expenses Administrative expenses 331,329 266,053 187,264 219,052 105,336 155,584 58,186 78,154 38,623 24,286 49,534 127,688 91,364 37,104 Total expenses Income before taxes 95,290 62,909 60,294 12,360 42,427 Income tax expense 16,994 8,613 Net income 24 74,370 24 47,934 2$ 33,814 KORBIN COMPANY Comparative Balance Sheets December 31, 2019, 2018, and 2017 2019 2018 2017 Assets Current assets $ 61,979 2$ $ 55,453 4,440 41,483 Long-term investments Plant assets, net 600 111,633 102,135 59,592 $ 19,485 Total assetsS $ 173,612 $ 144,218 Liabilitles and Equity Current liabilities Common stock Other paid-in capital Retained earnings 2$ 24 64,000 25,347 21,488 2$ 20,910 64,000 8,000 46,000 5,111 47,464 8,000 76,265 $ 173,612 50,730 Total liabilities and equity $ 144,218 $ 119,485 3. Complete the below table to calculate the balance sheet data in trend percents with 2017 as base year. (Round your percentage answers to 2 decimal places.)

Cornerstones of Financial Accounting
4th Edition
ISBN:9781337690881
Author:Jay Rich, Jeff Jones
Publisher:Jay Rich, Jeff Jones
Chapter12: Fainancial Statement Analysis
Section: Chapter Questions
Problem 48CE

Related questions
Question
100%
Transcribed Image Text:Selected comparative financial statements of Korbin Company follow.
KORBIN COMPANY
Comparative Income Statements
For Years Ended December 31, 2019, 2018, and 2017
2019
2018
2017
$ 292,600
Sales
$ 550,381
331,329
$ 421,637
Cost of goods sold
266,053
155,584
58,186
187,264
Gross profit
219,052
105,336
38,623
Selling expenses
78,154
49,534
127,688
91,364
16,994
Administrative expenses
37,104
24,286
Total expenses
95,290
60,294
12,360
62,909
Income before taxes
42,427
Income tax expense
8,613
Net income
74,370
47,934
33,814
KORBIN COMPANY
Comparative Balance Sheets
December 31, 2019, 2018, and 2017
2019
2018
2017
Assets
Current assets
Long-term investments
Plant assets, net
2$
61,979
%24
41,483
24
55,453
600
4,440
111,633
102.135
59,592
Total assets
173,612
24
144,218
$ 119,485
Liabilities and Equity
Current liabilities
2$
25,347
21,488
$
64,000
$
20,910
Common stock
64,000
46,000
Other paid-in capital
Retained earnings
8,000
8,000
5,111
47,464
76,265
50,730
Total liabilities and equity
24
173,612
$ 144,218
$ 119,485
3. Complete the below table to calculate the balance sheet data in trend percents with 2017 as base year. (Round your
percentage answers to 2 decimal places.)
KORBIN COMPANY
Balance Sheet Data in Trend Percents
December 31, 2019, 2018 and 2017
2019
2018
2017
Assets
Current assets
%
100.00 %
Long-term investments
100.00
Plant assets, net
100.00
Total assets
100.00 %
Liabilities and Equity
Current liabilities
100.00 %
Common stock
100.00
Other paid-in capital
100.00
Retained eamings
100.00
Total liabilities and equity
100.00 %
Expert Solution
This question has been solved!
Explore an expertly crafted, step-by-step solution for a thorough understanding of key concepts.

This is a popular solution!

Trending now
This is a popular solution!

Step by step
Solved in 3 steps with 2 images

Knowledge Booster


Learn more about
Need a deep-dive on the concept behind this application? Look no further. Learn more about this topic, accounting and related others by exploring similar questions and additional content below.Recommended textbooks for you
Cornerstones of Financial Accounting
Accounting
ISBN:
9781337690881
Author:
Jay Rich, Jeff Jones
Publisher:
Cengage Learning

Financial Accounting: The Impact on Decision Make…
Accounting
ISBN:
9781305654174
Author:
Gary A. Porter, Curtis L. Norton
Publisher:
Cengage Learning

Intermediate Accounting: Reporting And Analysis
Accounting
ISBN:
9781337788281
Author:
James M. Wahlen, Jefferson P. Jones, Donald Pagach
Publisher:
Cengage Learning
Cornerstones of Financial Accounting
Accounting
ISBN:
9781337690881
Author:
Jay Rich, Jeff Jones
Publisher:
Cengage Learning
Financial Accounting: The Impact on Decision Make…
Accounting
ISBN:
9781305654174
Author:
Gary A. Porter, Curtis L. Norton
Publisher:
Cengage Learning
Intermediate Accounting: Reporting And Analysis
Accounting
ISBN:
9781337788281
Author:
James M. Wahlen, Jefferson P. Jones, Donald Pagach
Publisher:
Cengage Learning

Principles of Accounting Volume 1
Accounting
ISBN:
9781947172685
Author:
OpenStax
Publisher:
OpenStax College

Fundamentals of Financial Management (MindTap Cou…
Finance
ISBN:
9781337395250
Author:
Eugene F. Brigham, Joel F. Houston
Publisher:
Cengage Learning

Intermediate Financial Management (MindTap Course…
Finance
ISBN:
9781337395083
Author:
Eugene F. Brigham, Phillip R. Daves
Publisher:
Cengage Learning