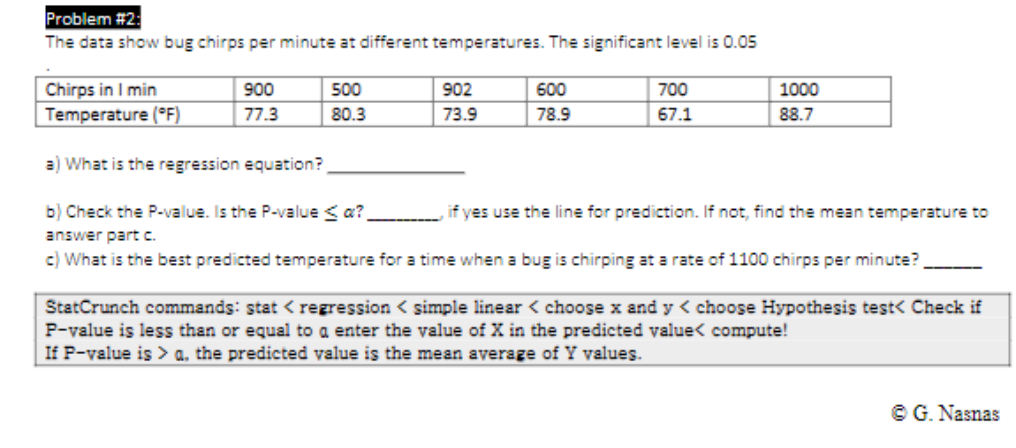
Problem #2: The data show bug chirps per minute at different temperatures. The significant level is 0.05 Chirps in I min Temperature (°F) 900 500 902 600 700 1000 77.3 80.3 73.9 78.9 67.1 88.7 a) What is the regression equation? b) Check the P-value. Is the P-value < a? answer part c. c) What is the best predicted temperature for a time when a bug is chirping at a rate of 1100 chirps per minute? if yes use the line for prediction. If not, find the mean temperature to StatCrunch commands: stat < regression < simple linear < choose x and y < choose Hypothesis test< Check if P-value is less than or equal to a enter the value of X in the predicted value< compute! If P-value is > a, the predicted value is the mean average of Y values. © G. Nasnas
Problem #2: The data show bug chirps per minute at different temperatures. The significant level is 0.05 Chirps in I min Temperature (°F) 900 500 902 600 700 1000 77.3 80.3 73.9 78.9 67.1 88.7 a) What is the regression equation? b) Check the P-value. Is the P-value < a? answer part c. c) What is the best predicted temperature for a time when a bug is chirping at a rate of 1100 chirps per minute? if yes use the line for prediction. If not, find the mean temperature to StatCrunch commands: stat < regression < simple linear < choose x and y < choose Hypothesis test< Check if P-value is less than or equal to a enter the value of X in the predicted value< compute! If P-value is > a, the predicted value is the mean average of Y values. © G. Nasnas
College Algebra
7th Edition
ISBN:9781305115545
Author:James Stewart, Lothar Redlin, Saleem Watson
Publisher:James Stewart, Lothar Redlin, Saleem Watson
Chapter1: Equations And Graphs
Section: Chapter Questions
Problem 10T: Olympic Pole Vault The graph in Figure 7 indicates that in recent years the winning Olympic men’s...
Related questions
Question
confused

Transcribed Image Text:Problem #2:
The data show bug chirps per minute at different temperatures. The significant level is 0.05
Chirps in I min
900
500
902
600
700
1000
Temperature (°F)
77.3
80.3
73.9
78.9
67.1
88.7
a) What is the regression equation?
b) Check the P-value. Is the P-value < a?
answer part c.
c) What is the best predicted temperature for a time when a bug is chirping at a rate of 1100 chirps per minute?
if yes use the line for prediction. If not, find the mean temperature to
StatCrunch commands: stat < regression < simple linear < choose x and y < choose Hypothesis test< Check if
P-value is less than or equal to a enter the value of X in the predicted value< compute!
If P-value is > a, the predicted value is the mean average of Y values.
© G. Nasnas
Expert Solution
This question has been solved!
Explore an expertly crafted, step-by-step solution for a thorough understanding of key concepts.
This is a popular solution!
Trending now
This is a popular solution!
Step by step
Solved in 3 steps with 3 images

Recommended textbooks for you

College Algebra
Algebra
ISBN:
9781305115545
Author:
James Stewart, Lothar Redlin, Saleem Watson
Publisher:
Cengage Learning

Algebra and Trigonometry (MindTap Course List)
Algebra
ISBN:
9781305071742
Author:
James Stewart, Lothar Redlin, Saleem Watson
Publisher:
Cengage Learning

Functions and Change: A Modeling Approach to Coll…
Algebra
ISBN:
9781337111348
Author:
Bruce Crauder, Benny Evans, Alan Noell
Publisher:
Cengage Learning

College Algebra
Algebra
ISBN:
9781305115545
Author:
James Stewart, Lothar Redlin, Saleem Watson
Publisher:
Cengage Learning

Algebra and Trigonometry (MindTap Course List)
Algebra
ISBN:
9781305071742
Author:
James Stewart, Lothar Redlin, Saleem Watson
Publisher:
Cengage Learning

Functions and Change: A Modeling Approach to Coll…
Algebra
ISBN:
9781337111348
Author:
Bruce Crauder, Benny Evans, Alan Noell
Publisher:
Cengage Learning

Algebra & Trigonometry with Analytic Geometry
Algebra
ISBN:
9781133382119
Author:
Swokowski
Publisher:
Cengage