
MATLAB: An Introduction with Applications
6th Edition
ISBN: 9781119256830
Author: Amos Gilat
Publisher: John Wiley & Sons Inc
expand_more
expand_more
format_list_bulleted
Related questions
Concept explainers
Topic Video
Question
thumb_up100%
Problem 6

Transcribed Image Text:Problem 6 Interpreting Multiple Linear
Regression Analysis
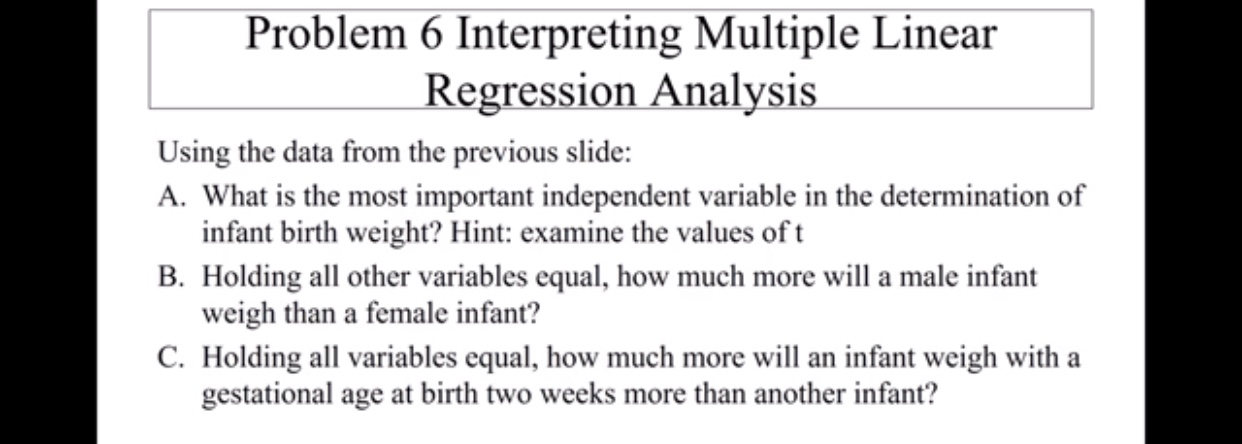
Using the data from the previous slide:
A. What is the most important independent variable in the determination of
infant birth weight? Hint: examine the values oft
B. Holding all other variables equal, how much more will a male infant
weigh than a female infant?
C. Holding all variables equal, how much more will an infant weigh with a
gestational age at birth two weeks more than another infant?
Transcribed Image Text:Problem 6 Interpreting Multiple Linear
Regression Analysis
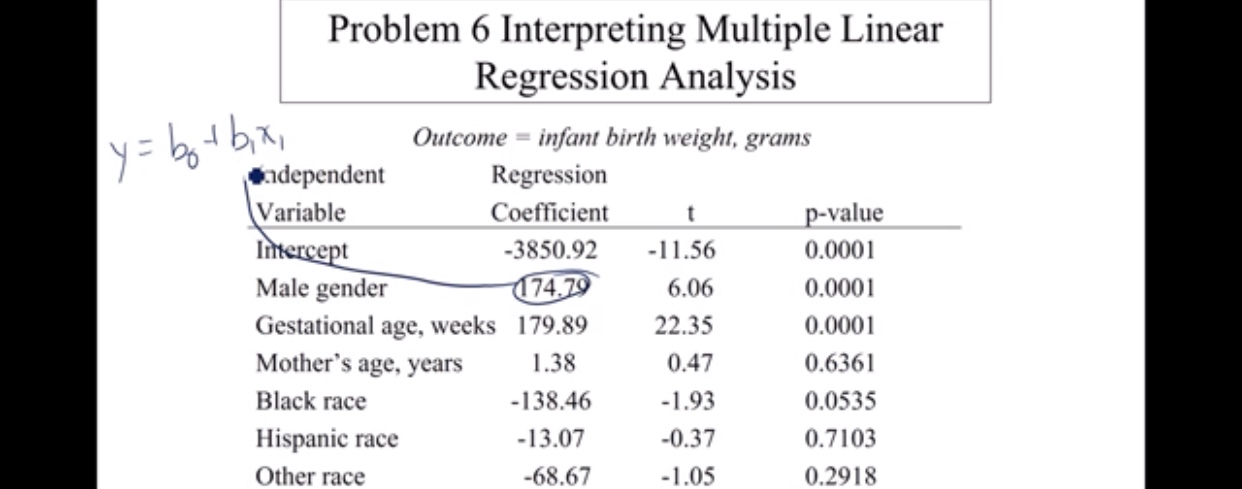
Outcome infant birth weight, grams
y=46
ndependent
Variable
Imtercept
Male gender
Regression
Coefficient
p-value
-3850.92
-11.56
0.0001
174,79
6.06
0.0001
Gestational age, weeks
Mother's age, years
179.89
22.35
0.0001
.38
0.47
0.6361
Black race
-138.46
0.0535
-1.93
Hispanic race
-13.07
-0.37
0.7103
Other race
-68.67
0.2918
-1.05
Expert Solution
This question has been solved!
Explore an expertly crafted, step-by-step solution for a thorough understanding of key concepts.

This is a popular solution

Trending nowThis is a popular solution!

Step by stepSolved in 2 steps

Knowledge Booster


Learn more about
Need a deep-dive on the concept behind this application? Look no further. Learn more about this topic, statistics and related others by exploring similar questions and additional content below.Similar questions
- Problem 5. Can tic-tac-toe be completed (5 ones and 4 zeros in A) so that rank(A) = 2 but neither side passed up a winning move?arrow_forwardProblem 6.3 How many zeros are there at the end of 100!?arrow_forwardProblem. 5 : Perform the indicated operations. -2 1 214 -1 -1 -21 5 1 -2 -3 -1 1 1 1 -2 0 -2arrow_forward
- A Problem 7 Suppose that a department contains 10 men and 15 women. How many ways are there to form a committee with six members if it must have more women than men? 4 Aarrow_forwardPlease use the approporate stats table provided. Do not use a software for this problem. Q17: If the mean number of serious accidents per year in a large factory (where the number of employees remains constant) is five, find the probability that in the current year there will be:a. No accidents b. One accident c. Two or morearrow_forwardplease can i have a step by step working out of this question. please can this question not be shared to others please. Thank you!arrow_forward
- Problem 5.4 (Grade a "Proof"). Study the following claim as well as the "proof": Claim. For all n e N, 3| (n³ +44n). “Proof". When n = 1, n³ +44n = 45 is divisible by 3. When n = 2, n³ +44n = 96 is divisible by 3. When n = 3, n³ + 44n = 159 is divisible by 3. When n = 100, n3 + 44n = 1004400 is divisible by 3. Thus 3 | (n³ +44n) for all n e N. %3D Complete the following questions concerning the above claim and "proof": (1) Determine whether the "proof" is rigorous. Identify the issues in the "proof", if any. (2) Determine whether the claim is true or false. Justify the answer in part (3). (3) If the the claim is true and the “proof" is not rigorous, then provide a correct and rigorous proof. If the claim is false, give a concrete counterexample. Hint. Complete the parts as instructed. If the claim is false, then (obviously) there is no way the "proof" could be correct.arrow_forward7 Problem 10. Given A= 2 5 -1 0 1 6 find A+13 -3 2arrow_forward
arrow_back_ios
arrow_forward_ios
Recommended textbooks for you
- MATLAB: An Introduction with ApplicationsStatisticsISBN:9781119256830Author:Amos GilatPublisher:John Wiley & Sons Inc
 Probability and Statistics for Engineering and th...StatisticsISBN:9781305251809Author:Jay L. DevorePublisher:Cengage Learning
 Statistics for The Behavioral Sciences (MindTap C...StatisticsISBN:9781305504912Author:Frederick J Gravetter, Larry B. WallnauPublisher:Cengage Learning
  Elementary Statistics: Picturing the World (7th E...StatisticsISBN:9780134683416Author:Ron Larson, Betsy FarberPublisher:PEARSON
 The Basic Practice of StatisticsStatisticsISBN:9781319042578Author:David S. Moore, William I. Notz, Michael A. FlignerPublisher:W. H. Freeman
 Introduction to the Practice of StatisticsStatisticsISBN:9781319013387Author:David S. Moore, George P. McCabe, Bruce A. CraigPublisher:W. H. Freeman
MATLAB: An Introduction with Applications
Statistics
ISBN:9781119256830
Author:Amos Gilat
Publisher:John Wiley & Sons Inc
Probability and Statistics for Engineering and th...
Statistics
ISBN:9781305251809
Author:Jay L. Devore
Publisher:Cengage Learning
Statistics for The Behavioral Sciences (MindTap C...
Statistics
ISBN:9781305504912
Author:Frederick J Gravetter, Larry B. Wallnau
Publisher:Cengage Learning
Elementary Statistics: Picturing the World (7th E...
Statistics
ISBN:9780134683416
Author:Ron Larson, Betsy Farber
Publisher:PEARSON
The Basic Practice of Statistics
Statistics
ISBN:9781319042578
Author:David S. Moore, William I. Notz, Michael A. Fligner
Publisher:W. H. Freeman
Introduction to the Practice of Statistics
Statistics
ISBN:9781319013387
Author:David S. Moore, George P. McCabe, Bruce A. Craig
Publisher:W. H. Freeman