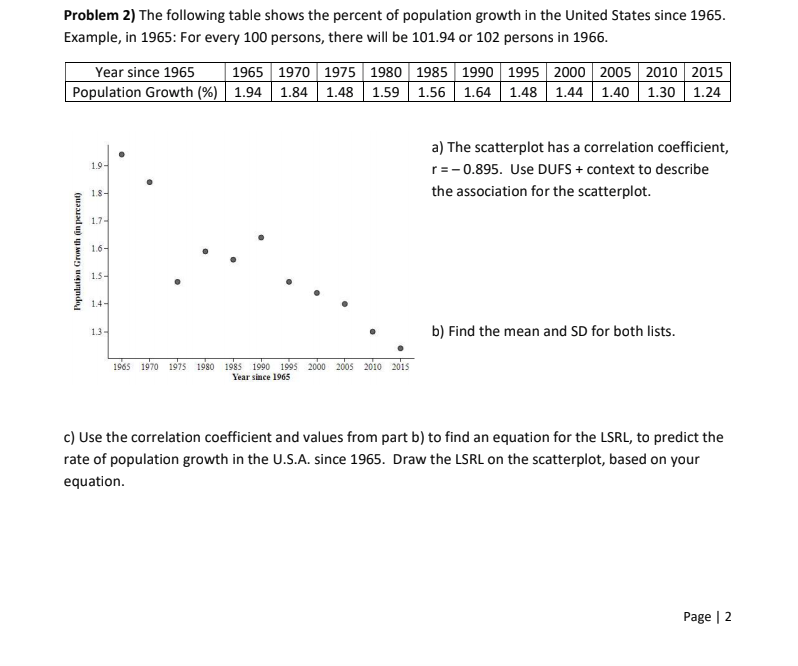
Problem 2) The following table shows the percent of population growth in the United States since 1965. Example, in 1965: For every 100 persons, there will be 101.94 or 102 persons in 1966. Year since 1965 Population Growth (%) | 1.94 | 1.84 1.48 1.59 1.56 | 1.64 | 1.48 | 1.44 1.40 | 1.30 1.24 | 1965 1970 1975 1980 | 1985 | 1990 1995 2000 2005 2010 | 2015 a) The scatterplot has a correlation coefficient, 1.9- r=-0.895. Use DUFS + context to describe 18- the association for the scatterplot. 1.7- 1.6- 1.5- 14- 13- b) Find the mean and SD for both lists. 1965 1970 1975 1980 1985 1990 1905 2000 2005 2010 2015 Year since 1965 c) Use the correlation coefficient and values from part b) to find an equation for the LSRL, to predict the rate of population growth in the U.S.A. since 1965. Draw the LSRL on the scatterplot, based on your equation. Pepulation Grmth in percent)


Addition Rule of Probability
It simply refers to the likelihood of an event taking place whenever the occurrence of an event is uncertain. The probability of a single event can be calculated by dividing the number of successful trials of that event by the total number of trials.
Expected Value
When a large number of trials are performed for any random variable ‘X’, the predicted result is most likely the mean of all the outcomes for the random variable and it is known as expected value also known as expectation. The expected value, also known as the expectation, is denoted by: E(X).
Probability Distributions
Understanding probability is necessary to know the probability distributions. In statistics, probability is how the uncertainty of an event is measured. This event can be anything. The most common examples include tossing a coin, rolling a die, or choosing a card. Each of these events has multiple possibilities. Every such possibility is measured with the help of probability. To be more precise, the probability is used for calculating the occurrence of events that may or may not happen. Probability does not give sure results. Unless the probability of any event is 1, the different outcomes may or may not happen in real life, regardless of how less or how more their probability is.
Basic Probability
The simple definition of probability it is a chance of the occurrence of an event. It is defined in numerical form and the probability value is between 0 to 1. The probability value 0 indicates that there is no chance of that event occurring and the probability value 1 indicates that the event will occur. Sum of the probability value must be 1. The probability value is never a negative number. If it happens, then recheck the calculation.
Can you help me on problem 2 A-C


Trending now
This is a popular solution!

Step by step
Solved in 4 steps with 3 images


