The following shows a linear correlation between the variables. 60 50 40 30 10 1 2 3 4 7 scatter plot positive histogram negative O pie chart parabolic O frequency distribution ----------- cumulative 20
The following shows a linear correlation between the variables. 60 50 40 30 10 1 2 3 4 7 scatter plot positive histogram negative O pie chart parabolic O frequency distribution ----------- cumulative 20

Glencoe Algebra 1, Student Edition, 9780079039897, 0079039898, 2018
18th Edition
ISBN:9780079039897
Author:Carter
Publisher:Carter
Chapter4: Equations Of Linear Functions
Section4.5: Correlation And Causation
Problem 24PFA

Related questions

Question
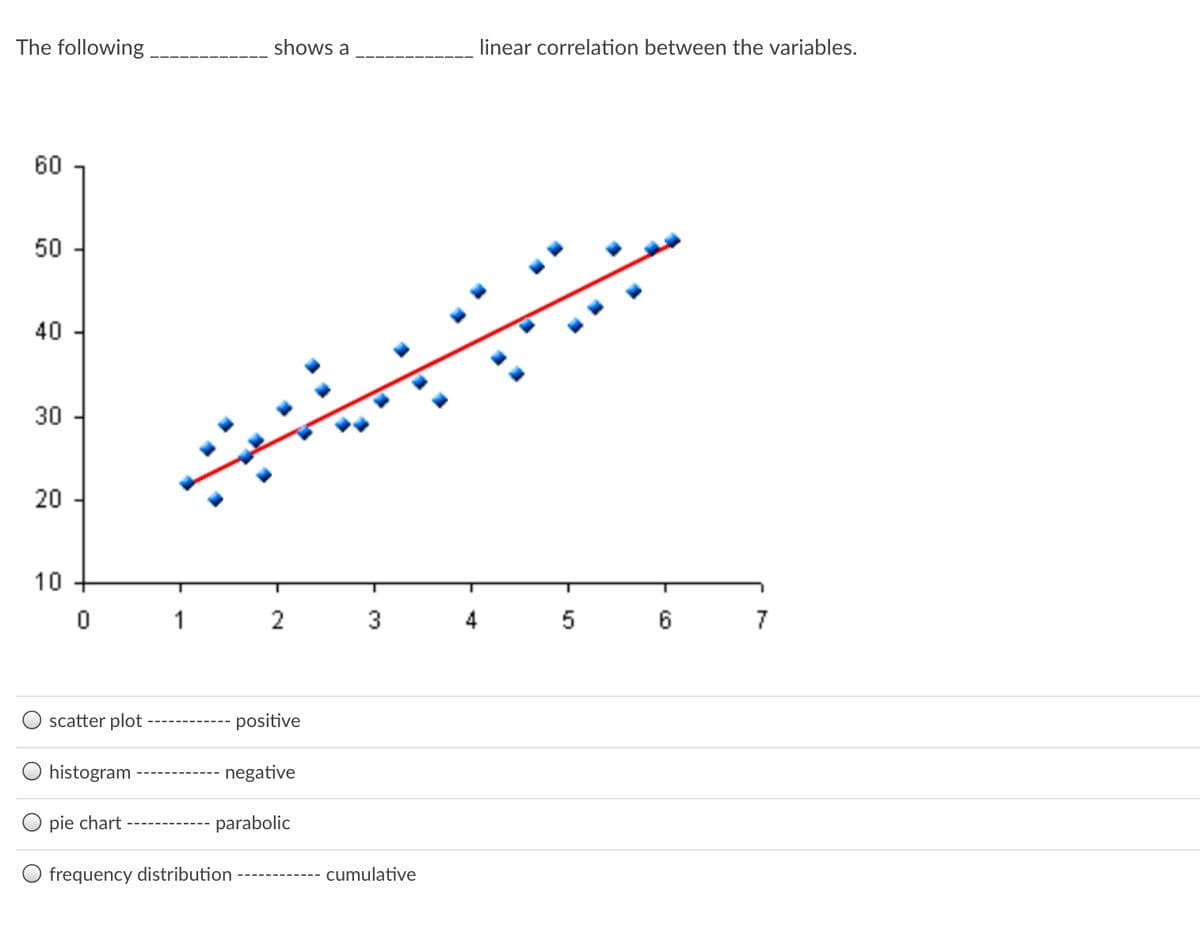
Transcribed Image Text:The following
shows a
linear correlation between the variables.
60
50
40
30
20
10
1
2
3
5
6
7
scatter plot
positive
histogram
negative
pie chart
parabolic
frequency distribution
cumulative
Expert Solution
This question has been solved!
Explore an expertly crafted, step-by-step solution for a thorough understanding of key concepts.

This is a popular solution!

Trending now
This is a popular solution!

Step by step
Solved in 2 steps

Knowledge Booster


Learn more about
Need a deep-dive on the concept behind this application? Look no further. Learn more about this topic, statistics and related others by exploring similar questions and additional content below.Recommended textbooks for you
Glencoe Algebra 1, Student Edition, 9780079039897…
Algebra
ISBN:
9780079039897
Author:
Carter
Publisher:
McGraw Hill
Glencoe Algebra 1, Student Edition, 9780079039897…
Algebra
ISBN:
9780079039897
Author:
Carter
Publisher:
McGraw Hill