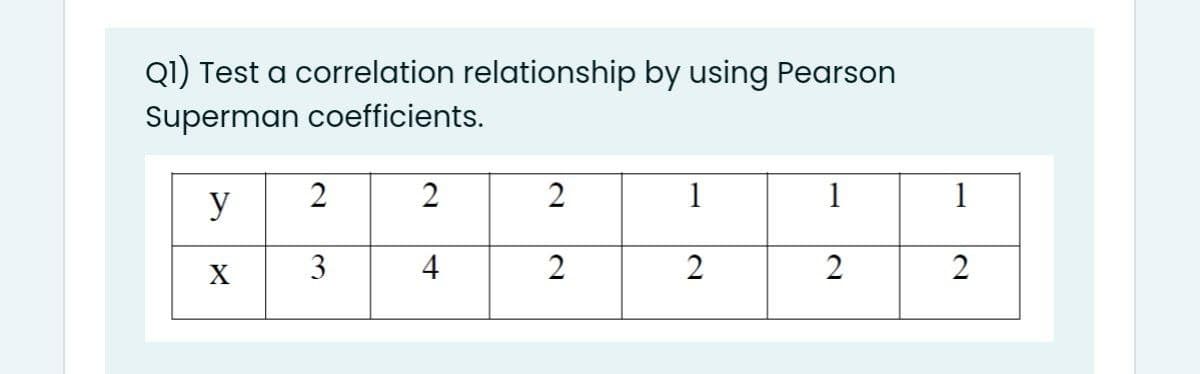
Q1) Test a correlation relationship by using Pearson Superman coefficients. 2 2 2 1 1 1 y 3 X 4 2 2 2 2


Q: Below are the enrollment for the last 5 years find the standard deviation 29307 11146 2258 1786…
A: Given n=5
Q: 4. A random sample of 15 students was selected from a population size of 100 (normal) in a certain…
A: Use the One Sample t test and there Confidence level Followings are the Explanation of the question…
Q: 1. Measurments were made on a thousand husbands and a thousand wives. If the measurements of…
A:
Q: Suppose that the weight of seedless watermelons is normally distributed with mean 6.9 kg. and…
A: The mean is 6.9 and the standard deviation is 1.2.
Q: A researcher wishes to estimate the proportion of adults who have high-speed Internet access. What…
A: The provided information is α=0.10 The critical value is z=1.64 (from statistical table) The…
Q: If I attend 3 more tutorials, what impact do I expect this to have on my final mark? The R2 value…
A: Please find the solution below. Thank you
Q: An English teacher was interested in studying the words of Macbeth. She took a random Sample of 300…
A: The set or collection of all possible observations is defined as the population.
Q: An ordinary (fair) coin is tossed 3 times. Outcomes are thus triples of "heads" (h) and "tails" (*)…
A: Given, heads (h) and tail(*) coin is tossed 3 times, therefore outcomes are ttt, hth, tht, htt,…
Q: 1. A school teacher suspects the claim that the mean number of students that use library materials…
A: The provided information is x¯=458s=9n=100α=0.05The degrees of freedom is df=n-1=100-1=99The…
Q: How sensitive are our consumers to changes in the rival good’s price? Explain in detail. Suppose we…
A: Please find the explanation below. Thank you
Q: Find the value for r, then interchange the values for x and y and find the value of r. Round your…
A: Given: x y 2 6 3 8 4 10 5 12 6 14
Q: The amount of coffee that people drink per day is normally distributed with a mean of 17 ounces and…
A:
Q: A study was done to know if there is a relationship between obesity and atherosclerosis. A total of…
A: Given The total participants in the study =775The participants with atherosclerosis =312 Among these…
Q: Based on the firm's data and the regression line, answer the following. (a) What was the observed…
A:
Q: In a town, out of 200 families with 4 children each, find the percentage of families having (i) 2…
A:
Q: 25. A bag contains n counters marked 1, 2, 3,, ... n. If two counters are drawn, show that the…
A:
Q: Find the value of X using Normal Distribution, if P(-X <Z <+X) = 0.9756 1.55 O 0.77 O 1.78 O 3.15 O…
A: Given,P(-X<Z<+X)=0.9756
Q: * In a particular road intersection, it has been observed that (2/3) of vehicles turn to the right…
A: In this specific case, it is given that 10 vehicles are observed, i.e., n=10. Considering each…
Q: Sacks of grain have an average weight of 120 Kilograms. It is found that 10% of the bags are over…
A: The provided information is µ=120x¯=125…
Q: 2. prospective MBA student was made to estimate the difference in the salaries of professors in…
A: The objective is to test whether there is a significant difference in the salaries of professors in…
Q: 12. For testing Ho: M1 = H2, HA: H1> U2 using the t-test, choose the correct statement A. The larger…
A: Given : To test : Ho:μ1=μ2 VS H1:μ1>μ2 Using t-test
Q: Consider two independent observations ₁ and 2 from a probability distribution where P(x = 0 − 1) =…
A:
Q: Calculate the following probabilities: 1. P(16<X<32), X-Gamma(3,8) 2. P(3<X<4), X~Lognormal(µ = 1,σ²…
A: Given: Gamma distribution: X~Gamma(α, β) The probability density function is given by: f(x) =…
Q: t*
A: Given Confidence interval for population mean=97% Sample size n=17
Q: A bar graph is used with [ Select] [ Select] one(s) next to it. A histogram is used with [ Select]…
A: In this case, we need to fill the suitable answers for the given statement.
Q: I NEED d and e answered !!! What is going on w y'all ... it clearly says I need d and e .... y'all…
A: Venn diagram looks like the form of circle and each circle indicate the event. It is used to measure…
Q: During the year about 15 percent of the population carry the flu virus. Supposed that 5 children…
A:
Q: A psychiatrist devised a short screening test for depression. An independent blind comparison was…
A: “Since you have posted a question with multiple sub-parts, we will solve first three sub-parts for…
Q: e great English diarist Samuel Pepys ked his friend Sir Isaac Newton the lowing question: Is it more…
A: Given that
Q: The daily sales of the two street vendors for 10 days are listed below. Vendor 1 Vendor 2 445 375…
A: Given data: Vendor 1 Vendor 2 445 375 540 576 623 589 455 375 550 575 625 625 675…
Q: Font Existing procurement practices in Ghana Highway Authority 1 Threshold, complexity and urgent…
A: Mean, and standard deviation are important measures of central tendency and variation.
Q: Find the characteristic function of a uniformly distributed random variable X in the range [0,1] and…
A:
Q: Statistics Bootstrap Distributions Assignment Create and analyze two bootstrap distributions using…
A:
Q: Create w = (1,3,5,..., 29). Give your R-code to subsequently remove all the components greater than…
A: R-code for the above problem is given as below: w= seq(from= 1, to= 29, by = 2)ww_remove <-…
Q: A student claims that statistics students at her school spend, on average, an hour doing statistics…
A: Null and alternative hypotheses: The hypothesis, which is pre assumed as true, tentatively settled…
Q: Year Global plastic production (tonnes·year¯¹) 1975 46,000,000 1978 64,000,000 1981 72,000,000 1984…
A:
Q: About 0.5% of adults have nut allergy. The test correctly identifies 94% of the time adults with…
A:
Q: A random sample of 120 observations produced a mean of = 30.7 from a population with a normal…
A: Given information Sample size n = 120 Sample mean x̅ = 30.7 Population standard deviation σ = 3.84…
Q: R Code
A: First write the R-code as below: ##First define the pdf given in the questionpdf <- function(x){…
Q: Calculate the following probabilities: 1. URNU P(16<X<32), X-Gamma(3,8) 2. P(3<X<4), X-Lognormal (u…
A: From the given information we find the probability.
Q: If out of a population consisting of 40% Hindus, 30% Muslims, 20% Sikhs, and 10% Christians, 10…
A:
Q: y = 53452634Xexp(0.0518X(x-1975)) x= years could you please a deep analysis of limitations of the…
A: In this question we are going to use the time series approach as well as regression model approach…
Q: Motorists arrive at a Gulf gas station at the rate of two per minute during morning hours. a) What…
A:
Q: P(Z>1.75) =
A: Let , Z is a standard normal distribution with mean 0 and var. 1 Then Z~N(0,1) Given that P(Z >…
Q: Equations shall be in below fomat sqaure not readable...
A: Please find the explanation below. Thank you
Q: Scenario: A guidance counselor wanted to know if anxiety differs based on time (first day of class…
A: In such case null hypothesis is, H0: The interaction is not statistically significant. And…
Q: A population has a standard deviation of 20.2. What is the standard error of the sampling…
A:
Q: An endangered species numbered 7,000 at the start of the year 2003 and at the start of 2014 numbered…
A: Given that: An endangered species numbered 7,000 at the start of the year 2003 At the start of 2014…
Q: 13. If the standard quota of State X is 35.41, then which of the following apportionments to State X…
A:
Q: A random sample of 28 size AA batteries for toys yield a mean of 3.27 hours with standard deviation…
A: Here, mean is 3.27 and standard deviation is 0.93. Sample size is 28.

Step by step
Solved in 2 steps with 2 images

- The authors of this study report a Pearson correlation coefficient estimate of r = 0.23 with a p-value of <0.01. Interpret.A zero correlation bewteen X and Y is least likely to occur if?b. Find the linear correlation coefficient, r, then determine whether there is sufficient evidence to support the claim of a linear correlation between the two variables.