
MATLAB: An Introduction with Applications
6th Edition
ISBN: 9781119256830
Author: Amos Gilat
Publisher: John Wiley & Sons Inc
expand_more
expand_more
format_list_bulleted
Related questions
Question

Transcribed Image Text:Statistics
Bootstrap Distributions Assignment
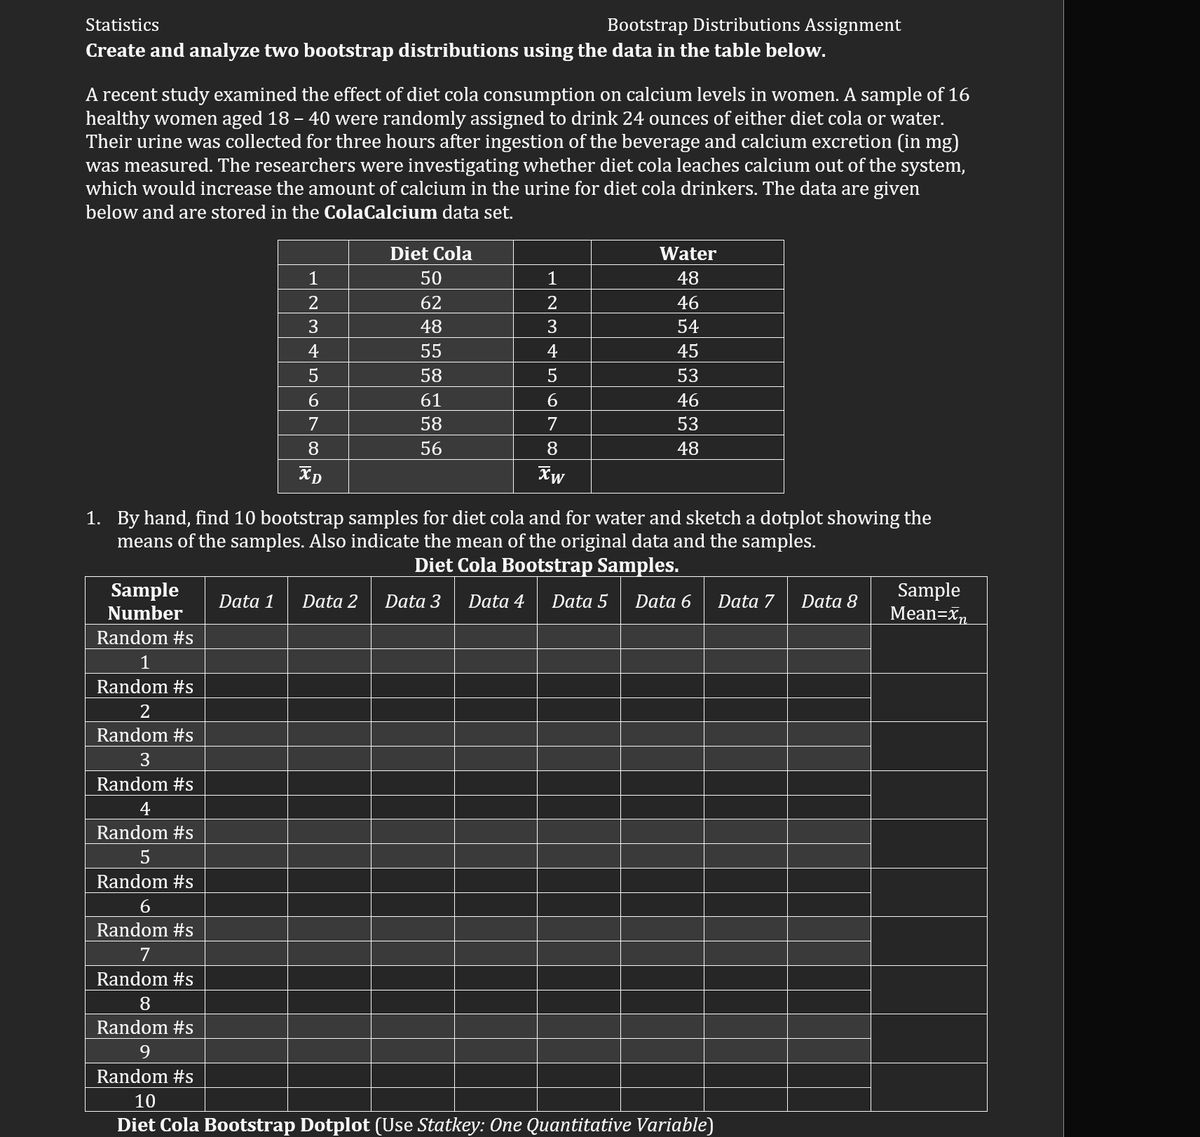
Create and analyze two bootstrap distributions using the data in the table below.
A recent study examined the effect of diet cola consumption on calcium levels in women. A sample of 16
healthy women aged 18 - 40 were randomly assigned to drink 24 ounces of either diet cola or water.
Their urine was collected for three hours after ingestion of the beverage and calcium excretion (in mg)
was measured. The researchers were investigating whether diet cola leaches calcium out of the system,
which would increase the amount of calcium in the urine for diet cola drinkers. The data are given
below and are stored in the ColaCalcium data set.
Diet Cola
Water
48
1
50
1
2
62
2
46
3
48
3
54
4
55
4
45
5
58
5
53
6
61
6
46
7
58
7
53
8
56
8
48
XD
Xw
1. By hand, find 10 bootstrap samples for diet cola and for water and sketch a dotplot showing the
means of the samples. Also indicate the mean of the original data and the samples.
Diet Cola Bootstrap Samples.
Data 4 Data 5 Data 6 Data 7
Data 8
Sample
Data 1 Data 2 Data 3
Number
Random #s
Sample
Mean=Xn
1
Random #s
2
Random #s
3
Random #s
4
Random #s
5
Random #s
6
Random #s
7
Random #s
8
Random #s
9
Random #s
10
Diet Cola Bootstrap Dotplot (Use Statkey: One Quantitative Variable)

Transcribed Image Text:Statistics
Water Bootstrap Samples.
Sample
Number
Data 3 Data 4 Data 5 Data 6
Sample
Mean=xn
Random #s
1
Random #s
Random #s
Random #s
4
Random #s
5
Random #s
6
Random #s
Random #s
8
Random #s
9
Random #s
10
Water Bootstrap Dotplot (Use Statkey: One Quantitative Variable)
2. Using StatKey, find 1000 bootstrap samples for diet cola and for water. Copy and paste a screen shot
of the resulting bootstrap distributions in the document.
3. Does it appear that the mean calcium lost for women who drink diet cola is more than for women
who drink water? Justify your answer.
4. Identify the Standard Error for each data set then construct a 95% confidence interval to estimate the
size of the effect.
263
Data 1
Bootstrap Distributions Assignment
Data 7
Data 8
Data 2
Expert Solution
This question has been solved!
Explore an expertly crafted, step-by-step solution for a thorough understanding of key concepts.

This is a popular solution

Trending nowThis is a popular solution!

Step by stepSolved in 5 steps with 5 images

Knowledge Booster

Similar questions
- The weight of a car can influence the mileage that the car can obtain. A random sample of 19 cars was taken and the weight (in pounds) and mileage (in mpg) were recorded and are in the table below. X, weight Y, mileage 2250 38.9 4500 17 4000 23.1 4500 19.5 3500 31.3 3500 31.3 3500 32.6 4000 23.4 4500 17.2 3500 28 5500 13.2 3500 28 2250 41.1 2500 40.9 2250 53.3 4000 23.6 3000 31.4 2750 46.9 3000 31.5 a) The symbol and value of the correlation coefficient are as follows: Round final answer to 2 decimal places. Select an answer r R² ρ ŷ y p̂ X̄ p μ σ s = Interpret this value: There is a strong Select an answer positive negative Select an answer linear quadratic bell-shaped uniform relation between weight and mileage for cars. b) The symbol and value of the coefficient of determination are as follows: Round final answer to 2 decimal places. Select an answer r r² ρ ŷ y p̂ X̄ p μ σ = Interpret this value: About…arrow_forwardA manufacturer of exercise equipment wanted to collect data on the effectiveness of their equipment. A magazine article compared how long it would take men and women to burn 200 calories during light or heavy workouts on various kinds of exercise equipment. The results summarized in the accompanying table are the average times for a group of physically active young men and women whose performances were measured on a representative sample of exercise equipment. Assume normality of the population. Complete parts (a) through (c) below. Click the icon to view the data table. C a) On average, how many minutes longer than a man must a woman exercise at a light exertion rate in order to burn 200 calories? Find a 95% confidence interval. minutes (Round to one decimal place as needed.) b) Estimate the average number of minutes longer a woman must work out at a light exertion than at heavy exertion to get the same benefit. Find a 95% confidence interval. (₁) minutes (Round to one decimal place…arrow_forwardYou may need to use the appropriate technology to answer this question. A certain manufacturer is a producer of aluminum components for the avionics and automotive industries. At its plant, an engineer has conducted a quality-control test in which aluminum coils produced in all three shifts were inspected. The study was designed to determine if the population proportion of good parts was the same for all three shifts. Sample data follow. Production Shift Quality First Second Third Good 282 364 172 Defective 18 36 28 (1) Using a 0.05 level of significance, conduct a hypothesis test to determine if the population proportion of good parts is the same for all three shifts. State the null and alternative hypotheses. A) H0: p1 = p2 = p3 Ha: Not all population proportions are equal. B) H0: p1 ≠ p2 ≠ p3 Ha: All population proportions are equal. C) H0: At least two population proportions are equal. Ha: p1 ≠ p2 ≠ p3 D) H0: Not all population proportions are equal. Ha: p1 =…arrow_forward
- Can you please help with this problem.arrow_forwardThe types of browse favored by deer are shown in the following table. Using binoculars, volunteers observed the feeding habits of a random sample of 320 deer. Type of Browse Plant Compositionin Study Area Observed Number of DeerFeeding on This Plant Sage brush 32% 103 Rabbit brush 38.7% 134 Salt brush 12% 38 Service berry 9.3% 23 Other 8% 22 Use a 5% level of significance to test the claim that the natural distribution of browse fits the deer feeding pattern. State the null and alternate hypotheses. A) Find the value of the chi-square statistic for the sample. (Round the expected frequencies to at least three decimal places. Round the test statistic to three decimal places.) B) Estimate the P-value of the sample test statistic. C) Based on your answers in parts (a) to (c), will you reject or fail to reject the null hypothesis that the…arrow_forwardFind the technique for gathering data in the study below.An analysis of a sample of 31,000 patients from New York hospitals suggests that the poor and the elderly sue for malpractice at one-fifth the rate of wealthier patients (Journal of the Medical Association).arrow_forward
- The National Football League (NFL) records a variety of performance data for individuals and teams. To investigate the importance of passing on the percentage of games won by a team, the following data show the average number of passing yards per attempt (Yds/Att) and the percentage of games won (WinPct) for a random sample of 10 NFL teams for the 2011 season (NFL website). Team Yds/Att WinPct 5.7 26 Arizona Cardinals Atlanta Falcons Carolina Panthers 7.6 67 7.3 52 6.9 51 Chicago Bears Dallas Cowboys 5.1 17 8.6 82 New England Patriots Philadelphia Eagles Seattle Seahawks 5.3 21 6.6 41 St. Louis Rams 6.5 41 Tampa Bay Buccaneers. 6.1 38 a. Choose the correct a scatter diagram with the number of passing yards per attempt on the horizontal axis and the percentage of games won on the vertical axis. B. A. WinPct WinPct 80 DD J F1 70- 60- 50+ -40- 30 20- F2 80 F3 000 000 F4 F5 80- -70 60- 50- 40- 30- 20- S F6 ● - F7 DII F8 F9 F10 () F11 <))) F12 Aarrow_forwardhis question refers to excavations at a national monument. One question the archaeologists asked was: Is raw material used by prehistoric Indians for stone tool manufacture independent of the archaeological excavation site? Two different excavation sites gave the information in the following table. Use a chi-square test with 5% level of significance to test the claim that raw material used for construction of stone tools and excavation site are independent. Excavation Site Material Site A Site B Row Total Basalt 756 559 1315 Obsidian 92 103 195 Pedernal chert 514 521 1035 Other 88 91 179 Column Total 1450 1274 2724 (a) What is the level of significance? (b) Find the value of the chi-square statistic for the sample. (Round the expected frequencies to at least three decimal places. Round the test statistic to three decimal places.)arrow_forwardYou want to find the prevalence of e-cigarette smoking is a given community. Which of these study designs would you use to test the hypothesis? Case-controlB. Cross-sectionalC. Cohort D. Experimental trialsarrow_forward
arrow_back_ios
arrow_forward_ios
Recommended textbooks for you
- MATLAB: An Introduction with ApplicationsStatisticsISBN:9781119256830Author:Amos GilatPublisher:John Wiley & Sons Inc
 Probability and Statistics for Engineering and th...StatisticsISBN:9781305251809Author:Jay L. DevorePublisher:Cengage Learning
 Statistics for The Behavioral Sciences (MindTap C...StatisticsISBN:9781305504912Author:Frederick J Gravetter, Larry B. WallnauPublisher:Cengage Learning
  Elementary Statistics: Picturing the World (7th E...StatisticsISBN:9780134683416Author:Ron Larson, Betsy FarberPublisher:PEARSON
 The Basic Practice of StatisticsStatisticsISBN:9781319042578Author:David S. Moore, William I. Notz, Michael A. FlignerPublisher:W. H. Freeman
 Introduction to the Practice of StatisticsStatisticsISBN:9781319013387Author:David S. Moore, George P. McCabe, Bruce A. CraigPublisher:W. H. Freeman
MATLAB: An Introduction with Applications
Statistics
ISBN:9781119256830
Author:Amos Gilat
Publisher:John Wiley & Sons Inc
Probability and Statistics for Engineering and th...
Statistics
ISBN:9781305251809
Author:Jay L. Devore
Publisher:Cengage Learning
Statistics for The Behavioral Sciences (MindTap C...
Statistics
ISBN:9781305504912
Author:Frederick J Gravetter, Larry B. Wallnau
Publisher:Cengage Learning
Elementary Statistics: Picturing the World (7th E...
Statistics
ISBN:9780134683416
Author:Ron Larson, Betsy Farber
Publisher:PEARSON
The Basic Practice of Statistics
Statistics
ISBN:9781319042578
Author:David S. Moore, William I. Notz, Michael A. Fligner
Publisher:W. H. Freeman
Introduction to the Practice of Statistics
Statistics
ISBN:9781319013387
Author:David S. Moore, George P. McCabe, Bruce A. Craig
Publisher:W. H. Freeman