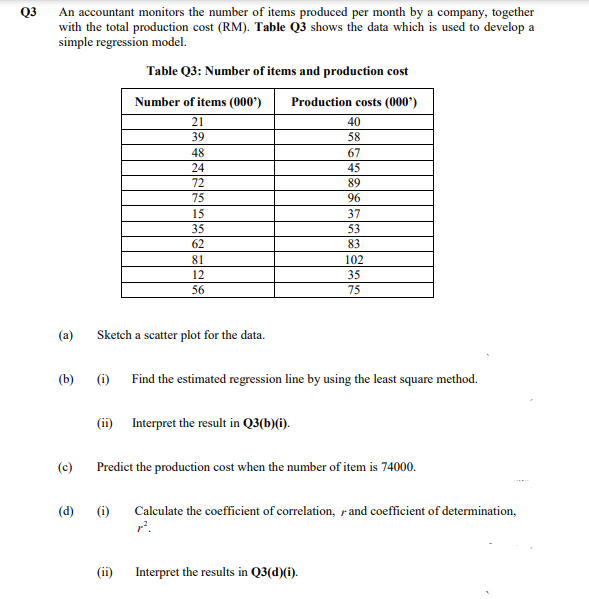
Q3 An accountant monitors the number of items produced per month by a company, together with the total production cost (RM). Table Q3 shows the data which is used to develop a simple regression model. Table Q3: Number of items and production cost Number of items (000') Production costs (000') 21 40 39 58 48 67 24 45 72 89 75 96 15 37 35 53 62 83 81 102 12 35 56 75 (a) Sketch a scatter plot for the data. (b) (i) Find the estimated regression line by using the least square method. (ii) Interpret the result in Q3(b)(i). (c) Predict the production cost when the number of item is 74000. (d) (i) Calculate the coefficient of correlation, rand coefficient of determination, r. (ii) Interpret the results in Q3(d)(i).
Q3 An accountant monitors the number of items produced per month by a company, together with the total production cost (RM). Table Q3 shows the data which is used to develop a simple regression model. Table Q3: Number of items and production cost Number of items (000') Production costs (000') 21 40 39 58 48 67 24 45 72 89 75 96 15 37 35 53 62 83 81 102 12 35 56 75 (a) Sketch a scatter plot for the data. (b) (i) Find the estimated regression line by using the least square method. (ii) Interpret the result in Q3(b)(i). (c) Predict the production cost when the number of item is 74000. (d) (i) Calculate the coefficient of correlation, rand coefficient of determination, r. (ii) Interpret the results in Q3(d)(i).

Glencoe Algebra 1, Student Edition, 9780079039897, 0079039898, 2018
18th Edition
ISBN:9780079039897
Author:Carter
Publisher:Carter
Chapter4: Equations Of Linear Functions
Section4.6: Regression And Median-fit Lines
Problem 22PFA

Related questions
Question
Transcribed Image Text:Q3
An accountant monitors the number of items produced per month by a company, together
with the total production cost (RM). Table Q3 shows the data which is used to develop a
simple regression model.
Table Q3: Number of items and production cost
Number of items (000')
Production costs (000')
21
40
39
58
48
67
24
45
72
89
75
96
15
37
35
53
62
83
81
102
12
35
56
75
(a)
Sketch a scatter plot for the data.
(b)
(i) Find the estimated regression line by using the least square method.
(ii) Interpret the result in Q3(b)(i).
(c)
Predict the production cost when the number of item is 74000.
(d)
(i)
Calculate the coefficient of correlation, rand coefficient of determination,
r.
(ii)
Interpret the results in Q3(d)(i).
Expert Solution
This question has been solved!
Explore an expertly crafted, step-by-step solution for a thorough understanding of key concepts.

Step by step
Solved in 4 steps with 3 images

Recommended textbooks for you
Glencoe Algebra 1, Student Edition, 9780079039897…
Algebra
ISBN:
9780079039897
Author:
Carter
Publisher:
McGraw Hill

College Algebra
Algebra
ISBN:
9781305115545
Author:
James Stewart, Lothar Redlin, Saleem Watson
Publisher:
Cengage Learning

Functions and Change: A Modeling Approach to Coll…
Algebra
ISBN:
9781337111348
Author:
Bruce Crauder, Benny Evans, Alan Noell
Publisher:
Cengage Learning
Glencoe Algebra 1, Student Edition, 9780079039897…
Algebra
ISBN:
9780079039897
Author:
Carter
Publisher:
McGraw Hill
College Algebra
Algebra
ISBN:
9781305115545
Author:
James Stewart, Lothar Redlin, Saleem Watson
Publisher:
Cengage Learning
Functions and Change: A Modeling Approach to Coll…
Algebra
ISBN:
9781337111348
Author:
Bruce Crauder, Benny Evans, Alan Noell
Publisher:
Cengage Learning

Algebra and Trigonometry (MindTap Course List)
Algebra
ISBN:
9781305071742
Author:
James Stewart, Lothar Redlin, Saleem Watson
Publisher:
Cengage Learning


Elementary Linear Algebra (MindTap Course List)
Algebra
ISBN:
9781305658004
Author:
Ron Larson
Publisher:
Cengage Learning