Question 1 An assembly line must be designed to produce 40 containers per hour. The following data give the necessary information Table 1 TASK IMMEDIATE PREDECESSOR TASK TIME (sec) A None 60 B A 12 C B 35 D A 55 E D 10 F E 50 G F, C 5 i. Draw the precedence diagram. ii. Compute the cycle time (in seconds) to achieve the desired output rate. iii. What is the theoretical minimum number of stations? iv. Assign the tasks to workstation? v. What is the efficiency of the line? vi. Calculate the idle time. Question 2 i. Differentiate between independent and dependent variable in forecasting. ii. The last seven weeks of sales at KC car dealership can be seen in Table 2 below. Table 2 Week Sales 1 25 2 30 3 27 4 31 5 27 6 29 7 30 8 a. Use a three-period weighted-moving average forecast to determine a forecast MGMT2026 Production and Operations Management for the 8th week using weights of 3, 2, and 1 (where the most recent week receives the highest weight). (Round all forecasts to the nearest whole unit.) b. Calculate the MAD for this forecast. c. What does the MAD indicate? iii. The number of students enrolled in Spring Valley Elementary school has been steadily increasing over the past five years. The School Board would like to forecast enrolment for years 6 and 7 in order to better plan capacity. The past five years enrolment is indicated in table 3: Table 3 Year Enrollment 1 220 2 245 3 256 4 289 5 310 Assuming a linear trend, use the tabular method to derive values for: a. the slope b. the intercept c. Forecast period 6 enrollment. Question 3 i. Sap Manufacturing, a manufacturing company that manufactures football jerseys and located in Port Antonio, Jamaica, is preparing to build a new plant. J’s is considering three potential locations that are suitable for the construction of the plant. The fixed and variable costs for the three alternative locations are presented in the table below. Table 4 Costs A B C Fixed Costs ($) 700,000 1, 000,000 1,100,000 Variable ($ per unit) 28 20 18 a. Identify the range over which each alternative (A, B and C) is best. MGMT2026 Production and Operations Management ii. A manufacturing firm is considering three potential locations for a new parts manufacturing facility. A consulting firm has assessed three sites based on the four factors supplied by management as critical to the location's success. The factor weights and the consultant team scores are given in table 5 below. Scores are based on 50 = best. Table 5 Location Factors Weights A B C Labor Climate 10 35 45 20 Taxes 30 30 40 40 Utilities 20 25 20 45 Wages 40 10 25 25 a. Which location should be selected? iii. Describe two factors that will affect the location decision of a supermarket and explain why these factors are important to the decision. Question 4 a. A fleet repair facility has the capacity to repair 800 trucks per month. However, due to scheduled maintenance of their equipment, management feels that they can repair no more than 600 trucks per month. Last month, two of the employees were absent several days each and only 400 trucks were repaired. What are the utilization and efficiency of the repair shop? b. Christopher's Cranks uses a machine that can produce 100 cranks per hour. The firm operates 12 hours per day, five days per week. Due to regularly scheduled preventive maintenance, the firm expects the machine to be running during approximately 95% of the available time. Based on experience with other products, the firm expects to achieve an efficiency level for the cranks of 85%. What is the expected weekly output of cranks for this company? c. Discuss five (5) techniques that can be used to manage capacity in the short-term.


Question 1
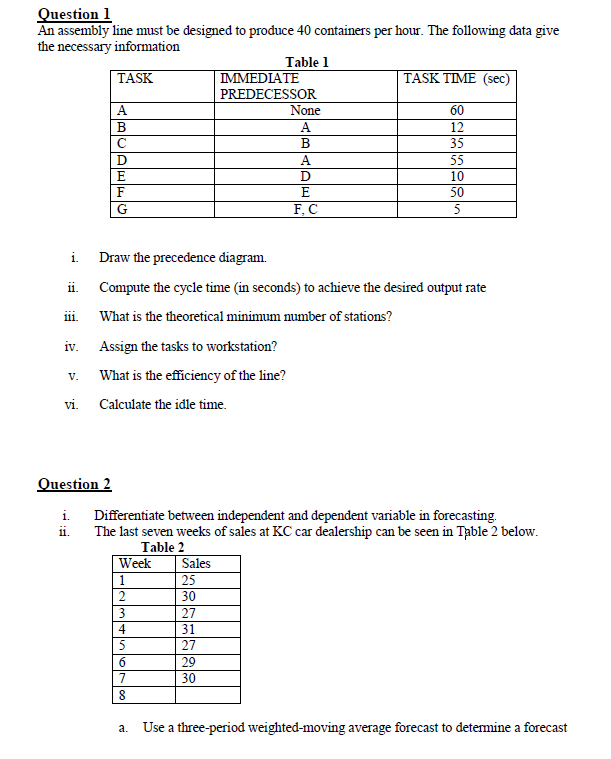
An assembly line must be designed to produce 40 containers per hour. The following data give
the necessary information
Table 1
TASK IMMEDIATE
PREDECESSOR
TASK TIME (sec)
A None 60
B A 12
C B 35
D A 55
E D 10
F E 50
G F, C 5
i. Draw the precedence diagram.
ii. Compute the cycle time (in seconds) to achieve the desired output rate.
iii. What is the theoretical minimum number of stations?
iv. Assign the tasks to workstation?
v. What is the efficiency of the line?
vi. Calculate the idle time.
Question 2
i. Differentiate between independent and dependent variable in forecasting.
ii. The last seven weeks of sales at KC car dealership can be seen in Table 2 below.
Table 2
Week Sales
1 25
2 30
3 27
4 31
5 27
6 29
7 30
8
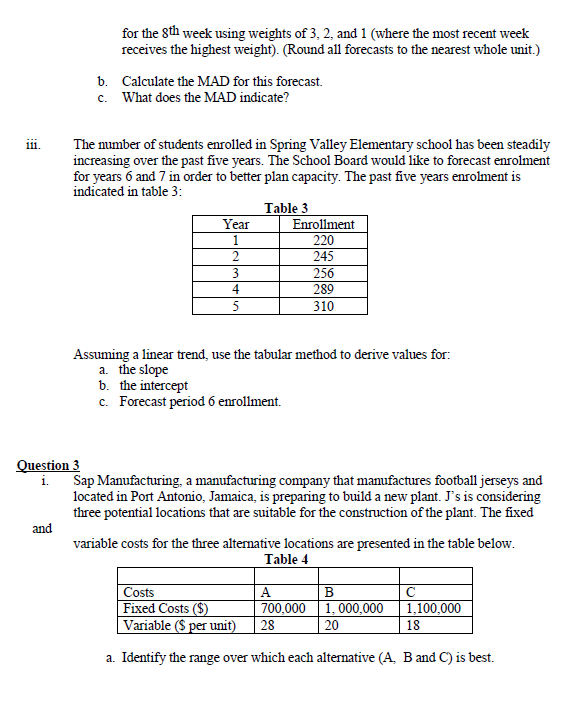
a. Use a three-period weighted-moving average
MGMT2026 Production and Operations Management
for the 8th week using weights of 3, 2, and 1 (where the most recent week
receives the highest weight). (Round all forecasts to the nearest whole unit.)
b. Calculate the MAD for this forecast.
c. What does the MAD indicate?
iii. The number of students enrolled in Spring Valley Elementary school has been steadily
increasing over the past five years. The School Board would like to forecast enrolment
for years 6 and 7 in order to better plan capacity. The past five years enrolment is
indicated in table 3:
Table 3
Year Enrollment
1 220
2 245
3 256
4 289
5 310
Assuming a linear trend, use the tabular method to derive values for:
a. the slope
b. the intercept
c. Forecast period 6 enrollment.
Question 3
i. Sap Manufacturing, a manufacturing company that manufactures football jerseys and
located in Port Antonio, Jamaica, is preparing to build a new plant. J’s is considering
three potential locations that are suitable for the construction of the plant. The fixed
and
variable costs for the three alternative locations are presented in the table below.
Table 4
Costs A B C
Fixed Costs ($) 700,000 1, 000,000 1,100,000
Variable ($ per unit) 28 20 18
a. Identify the range over which each alternative (A, B and C) is best.
MGMT2026 Production and Operations Management
ii. A manufacturing firm is considering three potential locations for a new parts
manufacturing facility. A consulting firm has assessed three sites based on the four
factors supplied by management as critical to the location's success. The factor
weights and the consultant team scores are given in table 5 below. Scores are based on
50 = best.
Table 5
Location
Factors Weights A B C
Labor Climate 10 35 45 20
Taxes 30 30 40 40
Utilities 20 25 20 45
Wages 40 10 25 25
a. Which location should be selected?
iii. Describe two factors that will affect the location decision of a supermarket and explain
why these factors are important to the decision.
Question 4
a. A fleet repair facility has the capacity to repair 800 trucks per month. However, due to
600 trucks per month. Last month, two of the employees were absent several days each and only
400 trucks were repaired. What are the utilization and efficiency of the repair shop?
b. Christopher's Cranks uses a machine that can produce 100 cranks per hour. The firm operates
12 hours per day, five days per week. Due to regularly scheduled preventive maintenance, the
firm expects the machine to be running during approximately 95% of the available time. Based
on experience with other products, the firm expects to achieve an efficiency level for the cranks
of 85%. What is the expected weekly output of cranks for this company?
c. Discuss five (5) techniques that can be used to manage capacity in the short-term.


Trending now
This is a popular solution!

Step by step
Solved in 2 steps with 1 images


