Sample statistics for annual earning: High school diploma Bachelor's degree or higher X1= $27,136 X2= $34,329 %3D %3D S1 = $2318 S2 = $4962 n1 = 15 n2 = 12 %3D The annual earnings of 15 people with a high school diploma and 12 people with a bachelor's degree or higher are shown above. Can you conclude that there is a difference in the mean annual earnings based on level of education? Use a = 0.01. Assume the populations are normally distributed and the population variances are not equal. a. Identify the claim and state Ho and Ha b. Identify the level of significance a and the degrees of freedom. c. Find the critical values and identify the rejection regions. d. Find the standardized test statistic t. Sketch a graph. e. Decide whether to reject the null hypothesis. f. Interpret the decision in the context of the original claim.
Sample statistics for annual earning: High school diploma Bachelor's degree or higher X1= $27,136 X2= $34,329 %3D %3D S1 = $2318 S2 = $4962 n1 = 15 n2 = 12 %3D The annual earnings of 15 people with a high school diploma and 12 people with a bachelor's degree or higher are shown above. Can you conclude that there is a difference in the mean annual earnings based on level of education? Use a = 0.01. Assume the populations are normally distributed and the population variances are not equal. a. Identify the claim and state Ho and Ha b. Identify the level of significance a and the degrees of freedom. c. Find the critical values and identify the rejection regions. d. Find the standardized test statistic t. Sketch a graph. e. Decide whether to reject the null hypothesis. f. Interpret the decision in the context of the original claim.

MATLAB: An Introduction with Applications
6th Edition
ISBN:9781119256830
Author:Amos Gilat
Publisher:Amos Gilat
Chapter1: Starting With Matlab
Section: Chapter Questions
Problem 1P

Related questions

Topic Video
Question
answer all in 2 questions please.
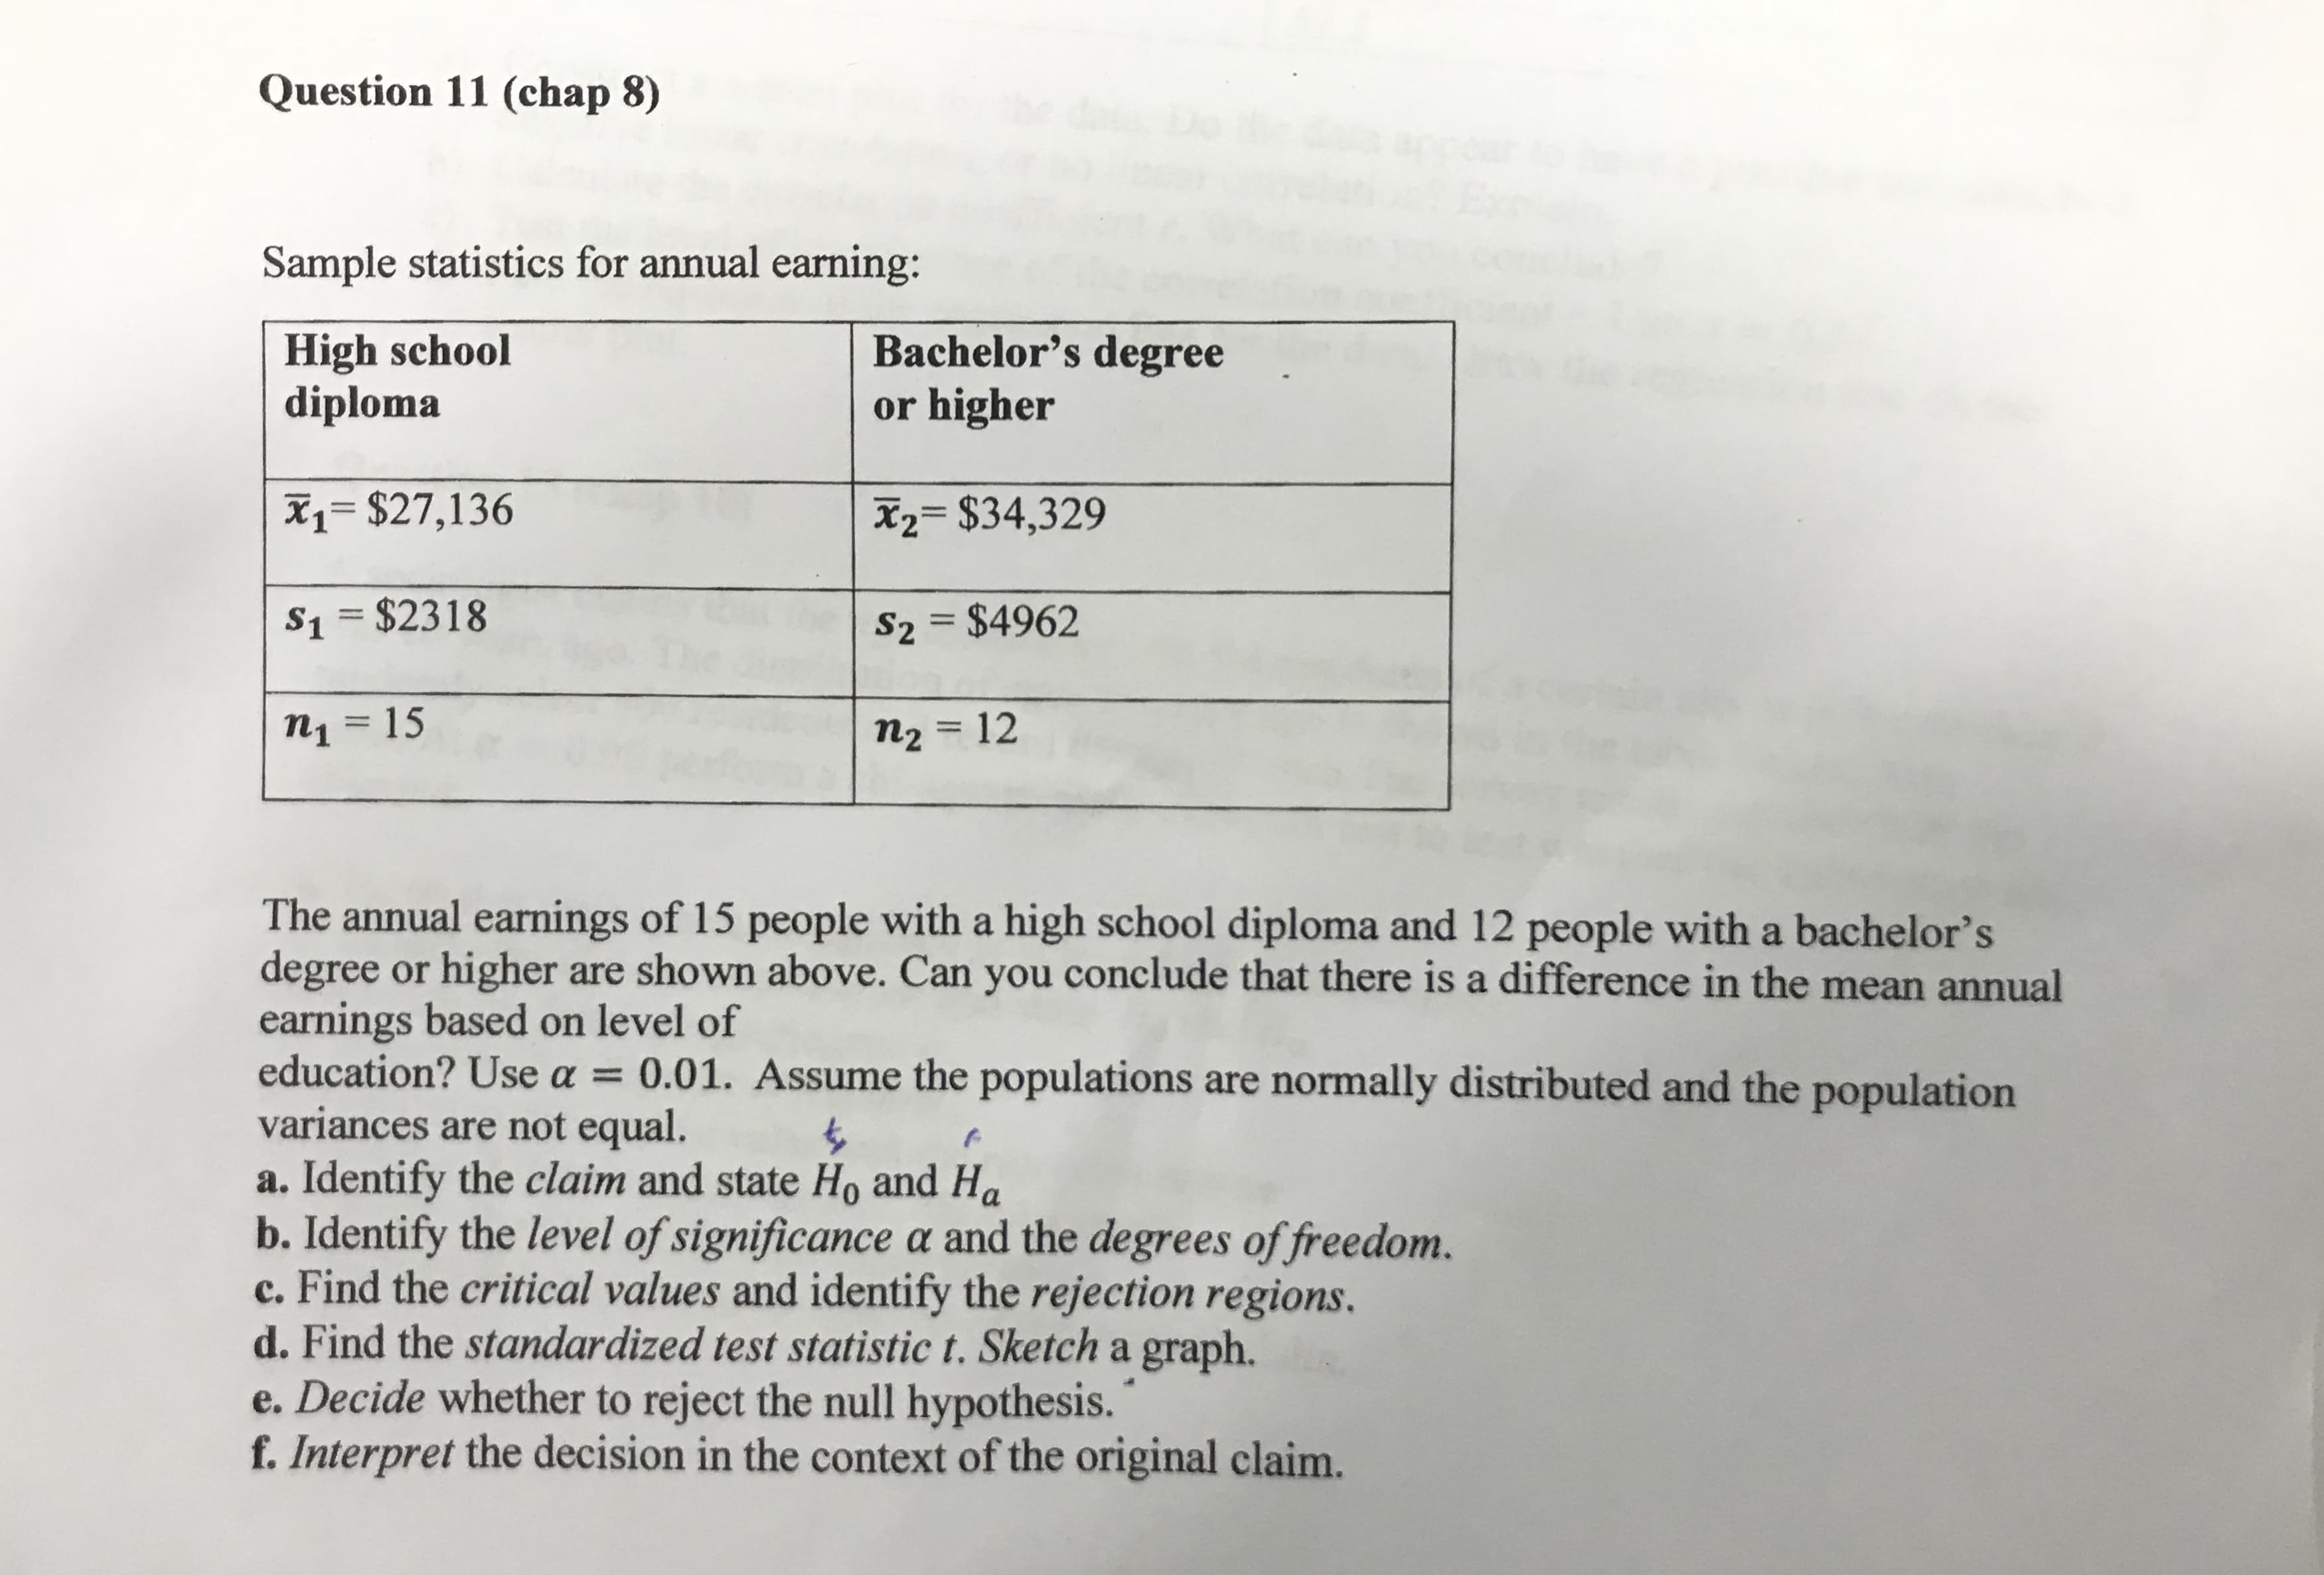
Transcribed Image Text:Sample statistics for annual earning:
High school
diploma
Bachelor's degree
or higher
X1= $27,136
X2= $34,329
%3D
%3D
S1 = $2318
S2 = $4962
n1 = 15
n2 = 12
%3D
The annual earnings of 15 people with a high school diploma and 12 people with a bachelor's
degree or higher are shown above. Can you conclude that there is a difference in the mean annual
earnings based on level of
education? Use a = 0.01. Assume the populations are normally distributed and the population
variances are not equal.
a. Identify the claim and state Ho and Ha
b. Identify the level of significance a and the degrees of freedom.
c. Find the critical values and identify the rejection regions.
d. Find the standardized test statistic t. Sketch a graph.
e. Decide whether to reject the null hypothesis.
f. Interpret the decision in the context of the original claim.
Expert Solution
This question has been solved!
Explore an expertly crafted, step-by-step solution for a thorough understanding of key concepts.

This is a popular solution!

Trending now
This is a popular solution!

Step by step
Solved in 2 steps with 4 images

Knowledge Booster


Learn more about
Need a deep-dive on the concept behind this application? Look no further. Learn more about this topic, statistics and related others by exploring similar questions and additional content below.Recommended textbooks for you
MATLAB: An Introduction with Applications
Statistics
ISBN:
9781119256830
Author:
Amos Gilat
Publisher:
John Wiley & Sons Inc

Probability and Statistics for Engineering and th…
Statistics
ISBN:
9781305251809
Author:
Jay L. Devore
Publisher:
Cengage Learning

Statistics for The Behavioral Sciences (MindTap C…
Statistics
ISBN:
9781305504912
Author:
Frederick J Gravetter, Larry B. Wallnau
Publisher:
Cengage Learning
MATLAB: An Introduction with Applications
Statistics
ISBN:
9781119256830
Author:
Amos Gilat
Publisher:
John Wiley & Sons Inc
Probability and Statistics for Engineering and th…
Statistics
ISBN:
9781305251809
Author:
Jay L. Devore
Publisher:
Cengage Learning
Statistics for The Behavioral Sciences (MindTap C…
Statistics
ISBN:
9781305504912
Author:
Frederick J Gravetter, Larry B. Wallnau
Publisher:
Cengage Learning

Elementary Statistics: Picturing the World (7th E…
Statistics
ISBN:
9780134683416
Author:
Ron Larson, Betsy Farber
Publisher:
PEARSON

The Basic Practice of Statistics
Statistics
ISBN:
9781319042578
Author:
David S. Moore, William I. Notz, Michael A. Fligner
Publisher:
W. H. Freeman

Introduction to the Practice of Statistics
Statistics
ISBN:
9781319013387
Author:
David S. Moore, George P. McCabe, Bruce A. Craig
Publisher:
W. H. Freeman