(a) Construct a 99.5% confidence interval for the mean number of hours it takes for a student to meet course objectives. Round the answers to one decimal place. (b) If a sample of 49 students had been studied, would you expect the interval to be wider or narrower than the interval constructed in part (a)? Explain.
(a) Construct a 99.5% confidence interval for the mean number of hours it takes for a student to meet course objectives. Round the answers to one decimal place. (b) If a sample of 49 students had been studied, would you expect the interval to be wider or narrower than the interval constructed in part (a)? Explain.

College Algebra (MindTap Course List)
12th Edition
ISBN:9781305652231
Author:R. David Gustafson, Jeff Hughes
Publisher:R. David Gustafson, Jeff Hughes
Chapter8: Sequences, Series, And Probability
Section8.7: Probability
Problem 58E: What is meant by the sample space of an experiment?

Related questions
Question
#8
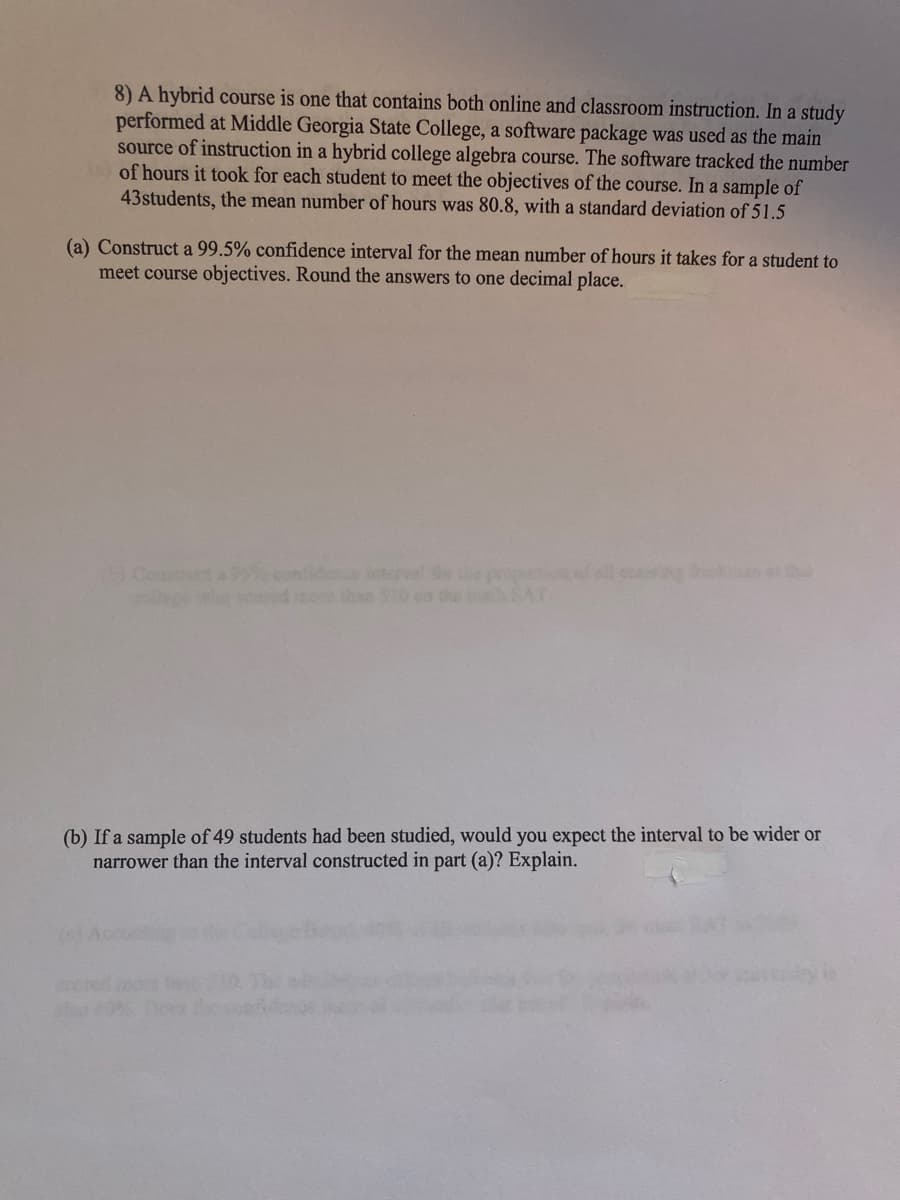
Transcribed Image Text:8) A hybrid course is one that contains both online and classroom instruction. In a study
performed at Middle Georgia State College, a software package was used as the main
source of instruction in a hybrid college algebra course. The software tracked the number
of hours it took for each student to meet the objectives of the course. In a sample of
43students, the mean number of hours was 80.8, with a standard deviation of 51.5
(a) Construct a 99.5% confidence interval for the mean number of hours it takes for a student to
meet course objectives. Round the answers to one decimal place.
(b) If a sample of 49 students had been studied, would you expect the interval to be wider or
narrower than the interval constructed in part (a)? Explain.
Expert Solution
This question has been solved!
Explore an expertly crafted, step-by-step solution for a thorough understanding of key concepts.

This is a popular solution!

Trending now
This is a popular solution!

Step by step
Solved in 2 steps

Recommended textbooks for you
College Algebra (MindTap Course List)
Algebra
ISBN:
9781305652231
Author:
R. David Gustafson, Jeff Hughes
Publisher:
Cengage Learning
College Algebra (MindTap Course List)
Algebra
ISBN:
9781305652231
Author:
R. David Gustafson, Jeff Hughes
Publisher:
Cengage Learning