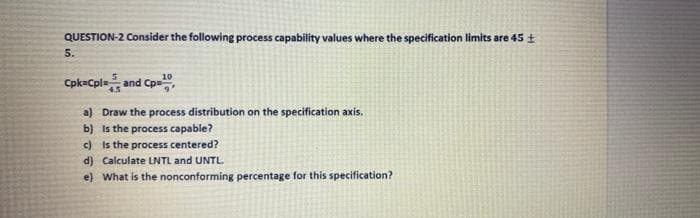
QUESTION-2 Consider the following process capability values where the specification limits are 45 t 5. Cpkacpl and Cp a) Draw the process distribution on the specification axis. b) Is the process capable? c) is the process centered?


Q: ABC Company has decided to use 20 test markets to examine the sensitivity of demand for its new…
A: Since you have posted a question with multiple subparts, we will solve first three subparts for you.…
Q: Determine the degree of skewness and kurtosis for the following data: Anxiety Level of Students…
A: A data can be raw or grouped, with some pro and cons associated with both of them. The raw data has…
Q: An expert estimates that the distribution parameter for durability times of parts produced with…
A:
Q: In a process capability analysis, C, = 10 Cpt =and Cpu = 0. a) Show the location of the process…
A: Please note that as per our guidelines we can answer the first three sub-parts. Please post the…
Q: The following values of saturation drain current ( lo, sat ) were collected from several test wafers…
A:
Q: 1) In the previous exercise, you perform DMC to correct the data in Station X. Table below is the…
A:
Q: Construct a hypothesis addressing which potato piece will have the greatest surface-area-to-volume…
A: Let us first understand what do we mean by a hypothesis. A hypothesis is a statement of no…
Q: 3. The measured soil water content of 16 samples at four depths is as follows: Soil Water contents (…
A:
Q: Given the following information and assuming independence of A and C Complete this Marginal…
A:
Q: The comparative boxplot (see below) of gasoline vapor coefficients for vehicles in Detroit appeared…
A: Answer:----. Date:----3/10/2021
Q: In a process capability analysis, C, =, Cpi = - and Cu = 0. a) Show the location of the process…
A: Since you have asked a question with multiple subparts so as per guidelines we will solve first…
Q: Refer to Exercise 7. Assume that p = 4.3 ± 0.1 cm and q = 2.1 ± 0.2 cm. Estimate f, and find the…
A:
Q: The following data is given: pO = 1500 T0 = 1/3 T 1= 2/3 Σ 1250 u1 = 5200 Using linear…
A:
Q: Given a standard normally distributed data with area left of z is 0.4050. Find the z-score.
A: Given that. X~N( 0 , 1 ) μ=0 , ?=1 (for standard normal distribution) Z-score =( x - μ )/?
Q: 45. The following table gives the distribtution of weekly income of 160 families in a town : Weekly…
A:
Q: For the given below data, determine ß1 and ß2 and also measure the kurtosis and identify which…
A: Kurtosis tells us whether the distribution, when plotted on a graph would give us a normal curve…
Q: 1. Using the above data we obtain the following descriptive statistics Deaths PCRTests Admissions…
A: As per guidelines, we will only answer first three subparts. a) Daily mean deaths in the UK over…
Q: Table 1: The density of four beetle species collected in quadrats of fixed size amongst three…
A: The central tendency is used to measure the location of observations. Average is a type of central…
Q: Use the second curve fitting criterion to minimize the sum of absolute deviations for the model y =…
A:
Q: 5. The following data represents thermal resistance for a certain metal tube as a function of…
A:
Q: Find the Fisher information in this sample of size n about the parameter 8.
A: First we have to calculate the log of f(x,θ) and its second derivative to determine the Fisher…
Q: Find the mean and standard deviation for each uniform continuous model U(1, 13) U(70, 200) U(3, 92)
A: Obtain the mean and standard deviation for the uniform continuous model U(1,13). Obtain the mean of…
Q: ASTM Standard E23 defines standard test methods for notched bar impact testing of metallic…
A: Given: Data 64.1 64.7 64.5 64.6 64.5 64.3 64.6 64.8 64.2 64.3…
Q: 10 In a process capability analysis, Cp =, Cpl =and Cpu = 0. 3 a) Show the location of the process…
A:
Q: Find the minimum sufficient statistic in the following situations. In order to establish minimality,…
A:
Q: Do you expect the distributions of the following variables to be symmetricor skewed? Explain.a. Size…
A: a.This is a Skewed Distribution because size in dollars of non-secured loans is not uniform. There…
Q: Data was collected for 40 randomly selected honey bee hives on a farm. The number of parasites found…
A: The horizontal axis of the histogram denotes the number of parasites.
Q: The management of Brinkley Corporation is interested in using simulation to estimate the profit per…
A:
Q: Construct index number of price from the following data by applying: 1)Fisher’s Ideal method…
A: Obtain the price index number of price from the following data by applying the Fisher’s Ideal…
Q: Q1 A) List down the measures of central tendency and measures of dispersion 2) The operations…
A: Mean is the average of all the observations. It is defined using the formula x¯=∑xn Variance is the…
Q: Before microwave ovens are sold, the manufacturer must check to ensure that the radiation coming…
A: a) Using the given data take the values of 1 to 25 from x axis , values of 1 to 20 on y-axis and…
Q: With a= .05, the two-tailed critical region for at test using a sample of n 20 participants would…
A: Givenα=0.05n=20test is two tailed
Q: For a Student’s t-distribution with mean 0, standard deviation 1, and degrees of freedom 49, which…
A: It is given that a student’s t-distribution with mean 0, standard deviation 1, and df is 49. In…
Q: QUESTION-2 Consider the following process capability values where the specification limits are 45 ±…
A: Since you have posted a question with multiple sub-parts, we will solve the first three sub-parts…
Q: 6) Here are some (simulated) data on the maximum age distribution in rabbits: age: 0 1 2 3 4 5 6 7 8…
A: Given data are as follows
Q: 1. Determine the degree of skewness and kurtosis of the following sets of data: a. Anxiety Level of…
A:
Q: For this grouped data set: Scores | Frequencies 30-34 | 7 25-29 |…
A:
Q: (iv) Find the Fisher information in this sample of size n about the parameter 8.
A: It is given that Xi, i = 1,2,......,n follows N(0, θ) (due to form of given pdf), then E(X) = 0 and…
Q: The article “Wastewater Treatment Sludge as a Raw Material for the Production of Bacillus…
A:
Q: The following table contains the measurements of the key length dimension from a fuel injector.…
A: Note: Hey, since there are multiple subparts posted, we will answer first three subparts. If you…
Q: Calculate Bowley's coefficient of skewness from the following data : Class Intervals : 0-5 5-10…
A:
Q: Q4/ The accompanying specific gravity values for various wood types used in construction appeared in…
A: Given that N=36
Q: (mg/ml) Absorbancy 540nm 0 0.158 1 0.210 2 0.260 3 0.305 4 0.360 5 0.410 6 0.455 7 0.510 8 0.530 9…
A:
Q: for a diver to De on DoL ean? Thlat depehus defines the "optimal time" to be the time at each depth…
A:
Q: Q2/ For the below frequency distribution table calculate all the below requiments 1- First Skewness…
A: Answer as following..
Q: Exercise 2. Consider ARIMA process (1+0.1B+0.4B²)(1 – B)Z = (1+0.2B)A¡, D(A¡)=o². Find the standard…
A:
Q: Estimate ff e+v dA with R = [0, 3] × [0, 3] using m = n = 2 and midpoints as your R sample points.
A: Solution:
Q: The data below are the termperatures on randomly chosen days during a summer class and the number of…
A: Solution-: Let, X=Temperature and Y=Number of absences We have following table: X Y 72 3 85 7…
Q: The table below shows the number of hours per day 11 patients suffered from headaches before and…
A: There are 2 dependent samples which are daily headache hours before and after. We have to test…

Step by step
Solved in 3 steps with 1 images

- over several weeks of normal, or in-control, operation, 20 samples of 150 packageseach of synthetic-gut tennis strings were tested for breaking strength. A total of 141packages of the 3000 tested failed to conform to the manufacturer’s specifications.a. what is an estimate of the process proportion defective when the system is in control?b. Compute the upper and lower control limits for a p chart.c. with the results of part (b), what conclusion should be made about the process if testson a new sample of 150 packages find 12 defective? Do there appear to be assignablecauses in this situation?d. Compute the upper and lower control limits for an np chart.e. Answer part (c) using the results of part (d)over several weeks of normal, or in-control, operation, 20 samples of 150 packageseach of synthetic-gut tennis strings were tested for breaking strength. A total of 141packages of the 3000 tested failed to conform to the manufacturer’s specifications.a. what is an estimate of the process proportion defective when the system is in control?b. Compute the upper and lower control limits for a p chart.c. with the results of part (b), what conclusion should be made about the process if testson a new sample of 150 packages find 12 defective? Do there appear to be assignablecauses in this situation?d. Compute the upper and lower control limits for an np chart.e. Answer part (c) using the results of part (d).f. which control chart would be preferred in this situation? Explain.over several weeks of normal, or in-control, operation, 20 samples of 150 packageseach of synthetic-gut tennis strings were tested for breaking strength. A total of 141packages of the 3000 tested failed to conform to the manufacturer’s specifications.a. what is an estimate of the process proportion defective when the system is in control?b. Compute the upper and lower control limits for a p chart.c. with the results of part (b), what conclusion should be made about the process if testson a new sample of 150 packages find 12 defective? Do there appear to be assignablecauses in this situation?
- Determine the heteroscedasticity in a scatter plot?A university interested in tracking its honors program believes that the proportion of graduates with a GPA of 3.00 or below is less than 0.20. In a sample of 200 graduates, 30 students have a GPA of 3.00 or below. In testing the university’s belief, how does one define the population parameter of interest?Listed below is the moisture content (by percent) for random samples of different fruits and vegetables. (image) a- At 5% significance level, can it be concluded that fruits differ from vegetables in average moisture content? Calculate the p-value and state the alternatives, and conclusion. b- Chick the assumptions of the above test.
- Consider an automatic production line that delivers computer components for inspection. According to the system’s specification, the interarrival time of the delivery follows a continuous uniform distribution between 5 to 15 minutes. The average inspection time of one component is 10 minutes. A simulation model was developed to replicate the system and eight samples were collected with the following data: Sample # 1 2 3 4 5 6 7 8 Interarrival time 14.7 14.8 6.8 11.6 6.3 13.3 7.9 10.3 Inspection time 8.3 5.7 4.0 9.0 10.6 5.9 8.5 7.0 Apply the Kolmogorov-Smirnov test, at the 1% level of significance, to test the hypothesis that the simulated interarrival times comply with the system’s specification. Conduct a statistical test to determine if the simulated inspection times are consistent with the system behavior at the 5% level of significance. Give another set of inspection times, 9.1, 12.7, 8.7, 10.8, 11.6, and 6.8,…A major car manufacturer wants to test a new engine to determine whether it meets new air pollution standards. The mean emission µ of all engines of type must be less than 20 parts per million of carbon. Ten engines are manufactured for testing purposes and the emission level of each is determined. The data (in parts per million) are listed below: 15.6 16.2 22.5 20.5 16.4 19.4 16.6 17.9 12.7 13.9 Do the data supply sufficient evidence to allow the manufacturer to conclude that this type of engine meets the pollution standard? Use a significance level of 5%.The Department of Natural Resources (DNR) received a complaint from recreational fishermen that a community was releasing sewage into the river where they fished. These types of releases lower the level of dissolved oxygen in the river and hence cause damage to the fish residing in the river. An inspector from the DNR designs a study to investigate the fishermen’s claim. Fifteen water samples are selected at locations on the river upstream from the community and fifteen samples are selected downstream from the community. The dissolved oxygen readings in parts per million (ppm) are given in the following table.Upstream 5.2 4.8 5.1 5.0 4.9 4.8 5.0 4.7 4.7 5.0 4.6 5.2 5.0 4.9 4.7, Downstream 3.2 3.4 3.7 3.9 3.6 3.8 3.9 3.6 4.1 3.3 4.5 3.7 3.9 3.8 3.7 a.In order for the discharge to have an impact on fish health, there needs to be at least a 0.5 ppm reduction in the dissolved oxygen. Do the data provide sufficient evidence that there is a large enough reduction in the mean dissolved oxygen…
- Consider the following examples of populations,together with the variable/characteristic measured on each population unit. a. Population: Accountability reports by State Universities and Colleges and Government Owned and Controlled Corporations submitted to the Commission on Audit.Variable: Total Disbursements REQUIRED: i. classify the variable ofinterest as either qualitative or quantitative,ii. determine the correspondinglevel of measurement of the variable.iii. Name another variable that canbe measured or observed from the population.An agent for a residential real estate company in a large city has the business objective of developing more accurate estimates of the monthly rental cost for apartments. Toward that goal, the agent would like to use the size of an apartment, as defined by square footage to predict the monthly rental cost. The agent selects a sample of 25 apartments in a particular residential neighborhood and collects the following data: Size (square feet) Rent ($) 850 1950 1450 2600 1085 2200 1232 2500 718 1950 1485 2700 1136 2650 726 1935 700 1875 956 2150 1100 2400 1285 2650 1985 3300 1369 2800 1175 2400 1225 2450 1245 2100 1259 2700 1150 2200 896 2150 1361 2600 1040 2650 755 2200 1000 1800 1200 2750 Make a Normal Probability Plot and a Residual plot of the Residuals (Y axis) vs. Apartment Size (X axis). Based on these results,…An agent for a residential real estate company in a large city has the business objective of developing more accurate estimates of the monthly rental cost for apartments. Toward that goal, the agent would like to use the size of an apartment, as defined by square footage to predict the monthly rental cost. The agent selects a sample of 25 apartments in a particular residential neighborhood and collects the following data: Size (square feet) Rent ($) 850 1950 1450 2600 1085 2200 1232 2500 718 1950 1485 2700 1136 2650 726 1935 700 1875 956 2150 1100 2400 1285 2650 1985 3300 1369 2800 1175 2400 1225 2450 1245 2100 1259 2700 1150 2200 896 2150 1361 2600 1040 2650 755 2200 1000 1800 1200 2750 (a) Construct a scatter plot. (b) Use the least-squares method to determine the regression coefficients (intercept and slope). (c)…