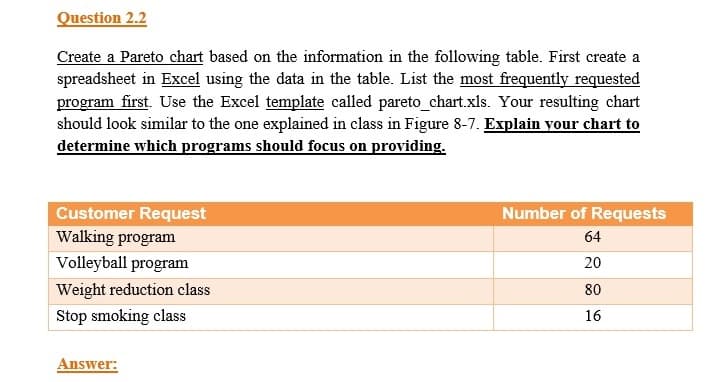
Question 2.2 Create a Pareto chart based on the information in the following table. First create a spreadsheet in Excel using the data in the table. List the most frequently requested program first. Use the Excel template called pareto_chart.xls. Your resulting chart should look similar to the one explained in class in Figure 8-7. Explain your chart to determine which programs should focus on providing. Customer Request Number of Requests Walking program 64 Volleyball program 20 Weight reduction class 80 Stop smoking class 16
Question 2.2 Create a Pareto chart based on the information in the following table. First create a spreadsheet in Excel using the data in the table. List the most frequently requested program first. Use the Excel template called pareto_chart.xls. Your resulting chart should look similar to the one explained in class in Figure 8-7. Explain your chart to determine which programs should focus on providing. Customer Request Number of Requests Walking program 64 Volleyball program 20 Weight reduction class 80 Stop smoking class 16

Linear Algebra: A Modern Introduction
4th Edition
ISBN:9781285463247
Author:David Poole
Publisher:David Poole
Chapter7: Distance And Approximation
Section7.3: Least Squares Approximation
Problem 31EQ

Related questions
Topic Video
Question
Transcribed Image Text:A
B
E
F
G
1
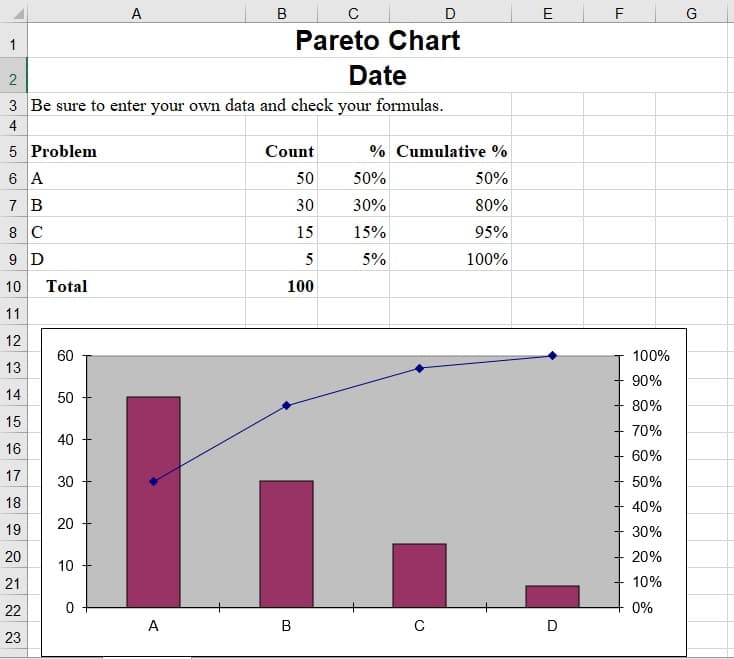
Pareto Chart
Date
3 Be sure to enter your own data and check your formulas.
4
5 Problem
Count
% Cumulative %
6 A
50
50%
50%
7 B
30
30%
80%
8 C
15
15%
95%
9 D
5
5%
100%
10
Total
100
11
12
60
100%
13
90%
14
50
80%
15
70%
40
16
60%
17
30
50%
18
40%
19
30%
20
20%
10
21
10%
22
0%
A
в
D
23
20
2.
Transcribed Image Text:Question 2.2
Create a Pareto chart based on the information in the following table. First create a
spreadsheet in Excel using the data in the table. List the most frequently requested
program first. Use the Excel template called pareto_chart.xls. Your resulting chart
should look similar to the one explained in class in Figure 8-7. Explain your chart to
determine which programs should focus on providing.
Customer Request
Number of Requests
Walking program
64
Volleyball program
20
Weight reduction class
80
Stop smoking class
16
Answer:
Expert Solution
This question has been solved!
Explore an expertly crafted, step-by-step solution for a thorough understanding of key concepts.

This is a popular solution!

Trending now
This is a popular solution!

Step by step
Solved in 4 steps with 1 images

Knowledge Booster


Learn more about
Need a deep-dive on the concept behind this application? Look no further. Learn more about this topic, statistics and related others by exploring similar questions and additional content below.Recommended textbooks for you
Linear Algebra: A Modern Introduction
Algebra
ISBN:
9781285463247
Author:
David Poole
Publisher:
Cengage Learning

Glencoe Algebra 1, Student Edition, 9780079039897…
Algebra
ISBN:
9780079039897
Author:
Carter
Publisher:
McGraw Hill
Linear Algebra: A Modern Introduction
Algebra
ISBN:
9781285463247
Author:
David Poole
Publisher:
Cengage Learning
Glencoe Algebra 1, Student Edition, 9780079039897…
Algebra
ISBN:
9780079039897
Author:
Carter
Publisher:
McGraw Hill