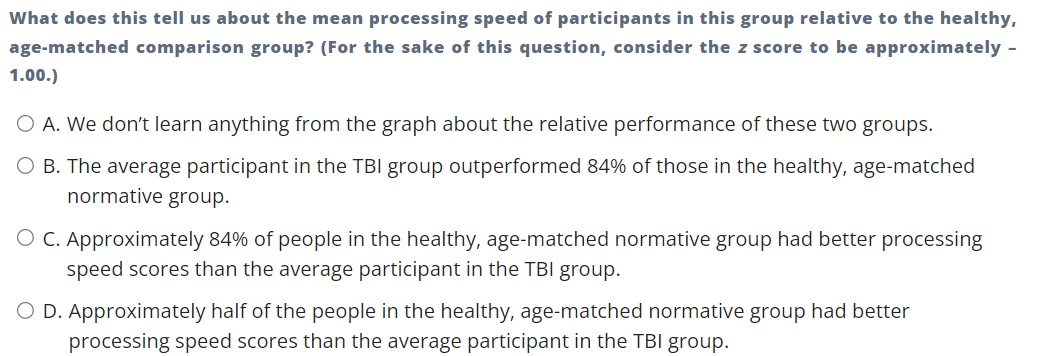
What does this tell us about the mean processing speed of participants in this group relative to the healthy, age-matched comparison group? (For the sake of this question, consider the z score to be approximately - 1.00.) O A. We don't learn anything from the graph about the relative performance of these two groups. O B. The average participant in the TBI group outperformed 84% of those in the healthy, age-matched normative group. O C. Approximately 84% of people in the healthy, age-matched normative group had better processing speed scores than the average participant in the TBI group. O D. Approximately half of the people in the healthy, age-matched normative group had better processing speed scores than the average participant in the TBI group.
What does this tell us about the mean processing speed of participants in this group relative to the healthy, age-matched comparison group? (For the sake of this question, consider the z score to be approximately - 1.00.) O A. We don't learn anything from the graph about the relative performance of these two groups. O B. The average participant in the TBI group outperformed 84% of those in the healthy, age-matched normative group. O C. Approximately 84% of people in the healthy, age-matched normative group had better processing speed scores than the average participant in the TBI group. O D. Approximately half of the people in the healthy, age-matched normative group had better processing speed scores than the average participant in the TBI group.

Big Ideas Math A Bridge To Success Algebra 1: Student Edition 2015
1st Edition
ISBN:9781680331141
Author:HOUGHTON MIFFLIN HARCOURT
Publisher:HOUGHTON MIFFLIN HARCOURT
Chapter4: Writing Linear Equations
Section: Chapter Questions
Problem 14CR

Related questions
Question
please use the graph to select the correct option with explanation I am stuck
Transcribed Image Text:What does this tell us about the mean processing speed of participants in this group relative to the healthy,
age-matched comparison group? (For the sake of this question, consider the z score to be approximately -
1.00.)
O A. We don't learn anything from the graph about the relative performance of these two groups.
O B. The average participant in the TBI group outperformed 84% of those in the healthy, age-matched
normative group.
O C. Approximately 84% of people in the healthy, age-matched normative group had better processing
speed scores than the average participant in the TBI group.
O D. Approximately half of the people in the healthy, age-matched normative group had better
processing speed scores than the average participant in the TBI group.
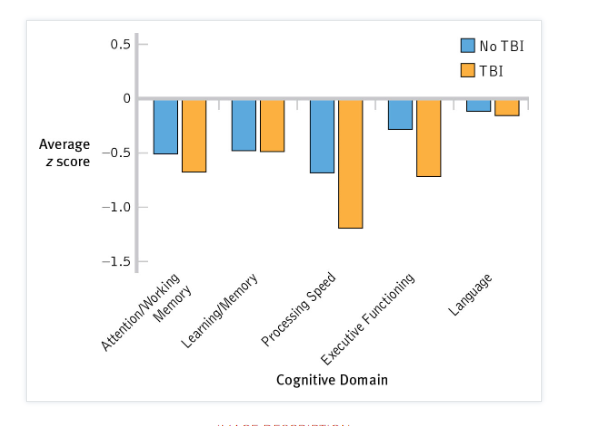
Transcribed Image Text:0.5
Average
-0.5
z score
|No TBI
|TBI
-1.0
-1.5
Attention/Working
Memory
Learning/Memory
Executive Functioning
Cognitive Domain
Processing Speed
Language
Expert Solution
This question has been solved!
Explore an expertly crafted, step-by-step solution for a thorough understanding of key concepts.

This is a popular solution!

Trending now
This is a popular solution!

Step by step
Solved in 2 steps

Recommended textbooks for you
Big Ideas Math A Bridge To Success Algebra 1: Stu…
Algebra
ISBN:
9781680331141
Author:
HOUGHTON MIFFLIN HARCOURT
Publisher:
Houghton Mifflin Harcourt

Glencoe Algebra 1, Student Edition, 9780079039897…
Algebra
ISBN:
9780079039897
Author:
Carter
Publisher:
McGraw Hill
Big Ideas Math A Bridge To Success Algebra 1: Stu…
Algebra
ISBN:
9781680331141
Author:
HOUGHTON MIFFLIN HARCOURT
Publisher:
Houghton Mifflin Harcourt
Glencoe Algebra 1, Student Edition, 9780079039897…
Algebra
ISBN:
9780079039897
Author:
Carter
Publisher:
McGraw Hill