Question 3: The relationship between the number of years of experience and salary for accountants in California is being studied. A sample of fourteen accountants were observed and the data recorded. The following scatterplot and regression analysis resulted: 90000 80000 n = 14 2 70000 ý = 58,111.29 + 2511.25x %3D
Question 3: The relationship between the number of years of experience and salary for accountants in California is being studied. A sample of fourteen accountants were observed and the data recorded. The following scatterplot and regression analysis resulted: 90000 80000 n = 14 2 70000 ý = 58,111.29 + 2511.25x %3D

College Algebra
7th Edition
ISBN:9781305115545
Author:James Stewart, Lothar Redlin, Saleem Watson
Publisher:James Stewart, Lothar Redlin, Saleem Watson
Chapter1: Equations And Graphs
Section: Chapter Questions
Problem 10T: Olympic Pole Vault The graph in Figure 7 indicates that in recent years the winning Olympic men’s...

Related questions
Question
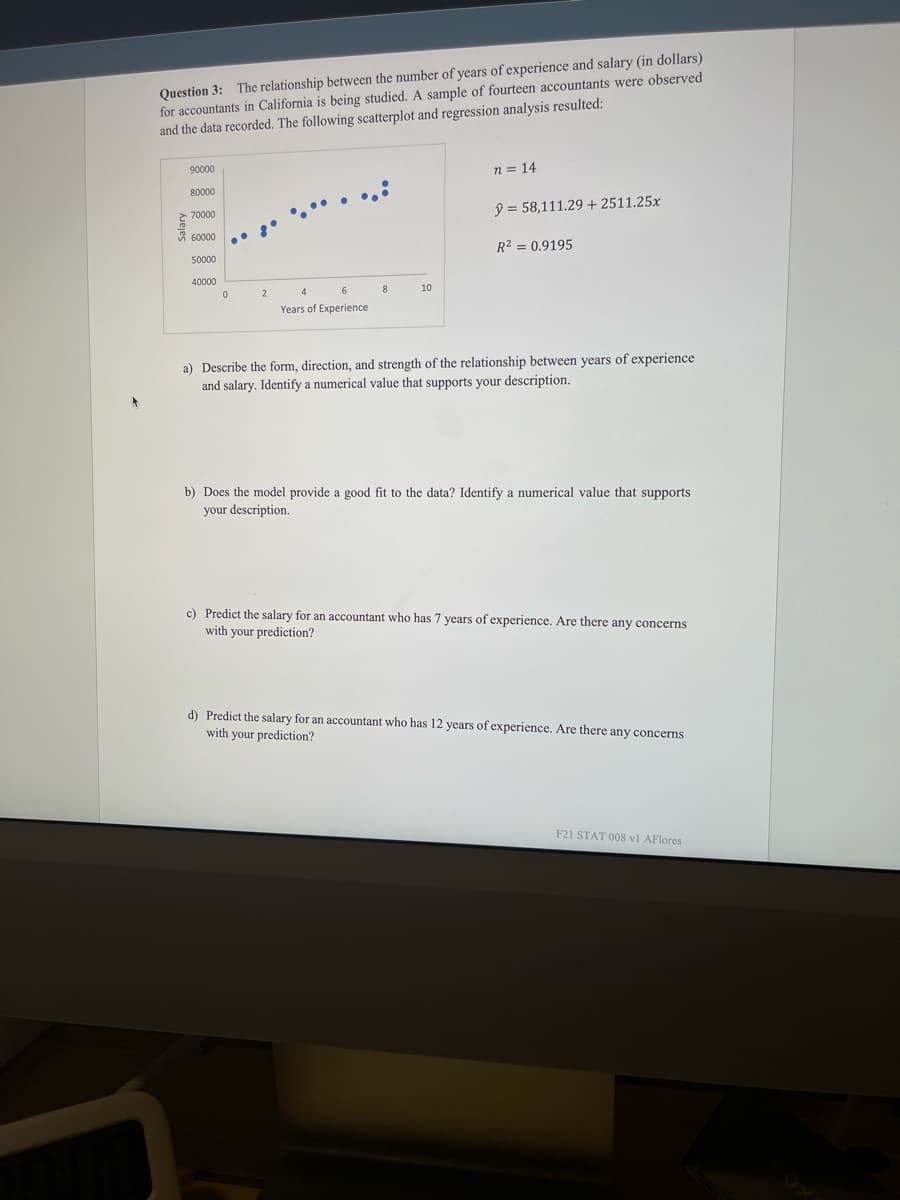
Transcribed Image Text:Question 3: The relationship between the number of years of experience and salary (in dollars)
for accountants in California is being studied. A sample of fourteen accountants were observed
and the data recorded. The following scatterplot and regression analysis resulted:
90000
n = 14
80000
ý = 58,111.29 + 2511.25x
70000
60000
R2 = 0.9195
50000
40000
2
4
8
10
Years of Experience
a) Describe the form, direction, and strength of the relationship between years of experience
and salary. Identify a numerical value that supports your description.
b) Does the model provide a good fit to the data? Identify a numerical value that supports
your description.
c) Predict the salary for an accountant who has 7 years of experience. Are there any concerns
with your prediction?
d) Predict the salary for an accountant who has 12 years of experience. Are there any concerns
with your prediction?
F21 STAT 008 v1 AFlores
Expert Solution
This question has been solved!
Explore an expertly crafted, step-by-step solution for a thorough understanding of key concepts.

Step by step
Solved in 2 steps

Recommended textbooks for you
College Algebra
Algebra
ISBN:
9781305115545
Author:
James Stewart, Lothar Redlin, Saleem Watson
Publisher:
Cengage Learning

Linear Algebra: A Modern Introduction
Algebra
ISBN:
9781285463247
Author:
David Poole
Publisher:
Cengage Learning

Algebra and Trigonometry (MindTap Course List)
Algebra
ISBN:
9781305071742
Author:
James Stewart, Lothar Redlin, Saleem Watson
Publisher:
Cengage Learning
College Algebra
Algebra
ISBN:
9781305115545
Author:
James Stewart, Lothar Redlin, Saleem Watson
Publisher:
Cengage Learning
Linear Algebra: A Modern Introduction
Algebra
ISBN:
9781285463247
Author:
David Poole
Publisher:
Cengage Learning
Algebra and Trigonometry (MindTap Course List)
Algebra
ISBN:
9781305071742
Author:
James Stewart, Lothar Redlin, Saleem Watson
Publisher:
Cengage Learning

Functions and Change: A Modeling Approach to Coll…
Algebra
ISBN:
9781337111348
Author:
Bruce Crauder, Benny Evans, Alan Noell
Publisher:
Cengage Learning