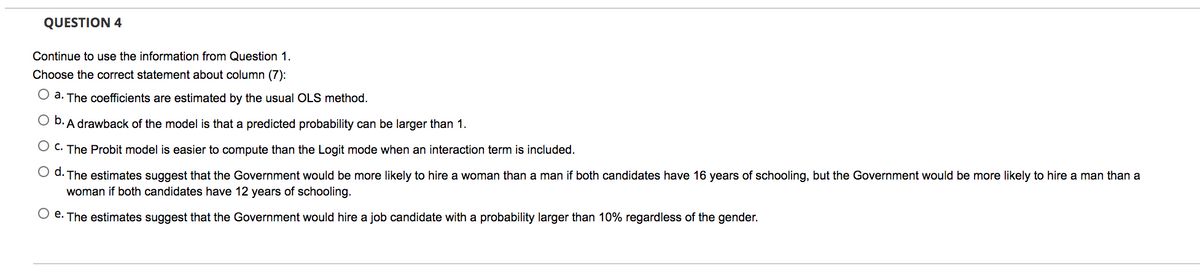
QUESTION 4 Continue to use the information from Question 1. Choose the correct statement about column (7): O a. The coefficients are estimated by the usual OLS method. O b. A drawback of the model is that a predicted probability can be larger than 1. O C. The Probit model is easier to compute than the Logit mode when an interaction term is included. O d. The estimates suggest that the Government would be more likely to hire a woman than a man if both candidates have 16 years of schooling, but the Government would be more likely to hire a man than a woman if both candidates have 12 years of schooling. O e. The estimates suggest that the Government would hire a job candidate with a probability larger than 10% regardless of the gender.
Q: Consider the following model of wage determination log(wage,) = 3o+Biedu; + B₂zp. + B3 female; +34…
A: For OLS estimation we are required to fulfill the following assumptions 1. The residuals from the…
Q: QUESTION 10 What proportion of shoppers at a supermarket in Lebanon nowadays are actually capable of…
A: Given: Confidence level = 96% Margin of error = 10% = 0.10 Formula Used: Margin of error =…
Q: Step 2 of 3: Find the first quartile.
A: Arrange the data in ascending order. S.no. X 1 41 2 43 3 44 4 46 5 48 6 50 7 54…
Q: Problem#1: On the desk of an office of a Banking Company, the arrivals of the customers follow…
A: Given Data: Let X be the arrivals of the customers at every 10 minutes X~ Poi (1) a) Let Y be the…
Q: Consider the following table from Neal & Johnson (1995). Which of the following statements are true:…
A: Hi! Thank you for the question, As per the honor code, we are allowed to answer one question at a…
Q: If the population starts with 20,000 this year, approximately how many indiviuals will there be next…
A: A stock-recruit curve is used to look at dynamics of the population. This stock-recruit graphs shows…
Q: Calculate a 95% confidence interval for the difference in true proportion of the carrier bags which…
A: n1 be the carrier bags made from jicama type A =100 n2 be the carrier bags made from jicama type B…
Q: The following table gives the U.S. population, ages 20–64, (in millions) for selected years from…
A: From the given data, Year Number of years after 1950 U.S. population (in millions) ages 20–64…
Q: [Question 19 The common stock of DEE Bhd. has a beta of 1.24 and an actual expected return of 13.25…
A: As per CAPM ,Expected return = Risk free return + (Market return-Risk free return )*Beta…
Q: The last 15 months of sales data are given below: Jan Feb Mar Apr May 2020 13.7 14.7 14.8 13 14 2021…
A: The value of variable Yt for each value corresponding to Xt is as follows Month Xt Yt Jan-20…
Q: The following logit model of house ownership is estimated. Y, = -1, 4097 +0,0326.X, where Y=1 if the…
A: There seems to be a typo in the equation. We assume that comma was mistakenly typed instead of…
Q: Consider the following survival tables relative two survival data of a clinical trial where survival…
A: There are two survival data given. One data is for the control group with no medical device and the…
Q: Example 17.18. Obtain the MVB estimator for u in normal population N(µ, ở), where o? is known.
A:
Q: The table below shows the number of chickens slaughtered during each month of 2021, as wel as the…
A: Given the data as Date t Birds Slaughtered Yt Slaughter ForecastY^t, WMA 1/28/2021 6045000…
Q: 4. Consider the following survival tables relative two survival data of a clinical trial where…
A: Hii
Q: Question 4. The distribution of yield strength of steel bars in batch A is normal with mean 40,000…
A: Express the equation for Coefficient of variance. C.V=σμ×100 Calculate the standard deviation of the…
Q: Question # 1…
A: “Since you have posted a question with multiple sub-parts, we will solve first three sub-parts for…
Q: "A health psychologist wants to determine whether a new exercise effects the rate of heart attacks…
A: The zα/2 critical value of the standard normal distribution, is the value, above which, 100 (α/2) %…
Q: For an alpha = .10 and degrees of freedom, df = 32, what is the one-tailed t-value? Give your answer…
A: According to the provided information, Singificacne level (α) = 0.10 Degrees of freedom (df) = 32
Q: Question 3 Let P be a random variable having a uniform distribution with minimum 0 and maximum 3…
A: The probability density function for the random variable P~Uniform0,3 is, fx=13-0=13 for 0≤x≤3=0…
Q: QUESTION 1 Consider the following regression model, Yi=B1+B2X12++ BxXik+ ej E[e,x,]=0 and Varle,x)…
A: The regression model is yi=β1+β2xi2+...........+βkxik+ei where E(eixi)=0 and var(eixi) depends on…
Q: Question 6 Suppose that among 10,000 women with negative mammograms, 20 will be diagnosed with…
A: From the given information, among 10,000 women with negative mammograms, 20 will be diagnosed with…
Q: Question 4 The owner of the restaurant serving Continental-style entrees was interested in…
A: Note:Hi! Thank you for posting the question. Since your question has more than 3 parts, we have…
Q: Question 3. Answer “YES “ or “No” to the following questions a. In ANOVA completely randomized…
A: “Since you have posted a question with multiple sub-parts, we will solve first three sub parts for…
Q: Question 17 Class interval (hours)| # pumps failed (frequency) 1000 – 1100 20 1100 – 1200 32 1200 –…
A: Thanks for giving opportunity to serve for bartleby students, "I HOPE YOU ARE HAPPY WITH MY…
Q: Question 5 Consider the following confusion matrix for a predictive logistic model. Predicted actual…
A: Given table : Predicted Actual 0 1 0 152 23 1 47 103 To find Sensitivity and…
Q: Question 1 A car company claims that their Super Spiffy Sedan averages 31 mpg. You randomly select 8…
A:
Q: Consider a simple model to explain a country’s alcohol related automobiles incidents (totaai) in…
A:
Q: 
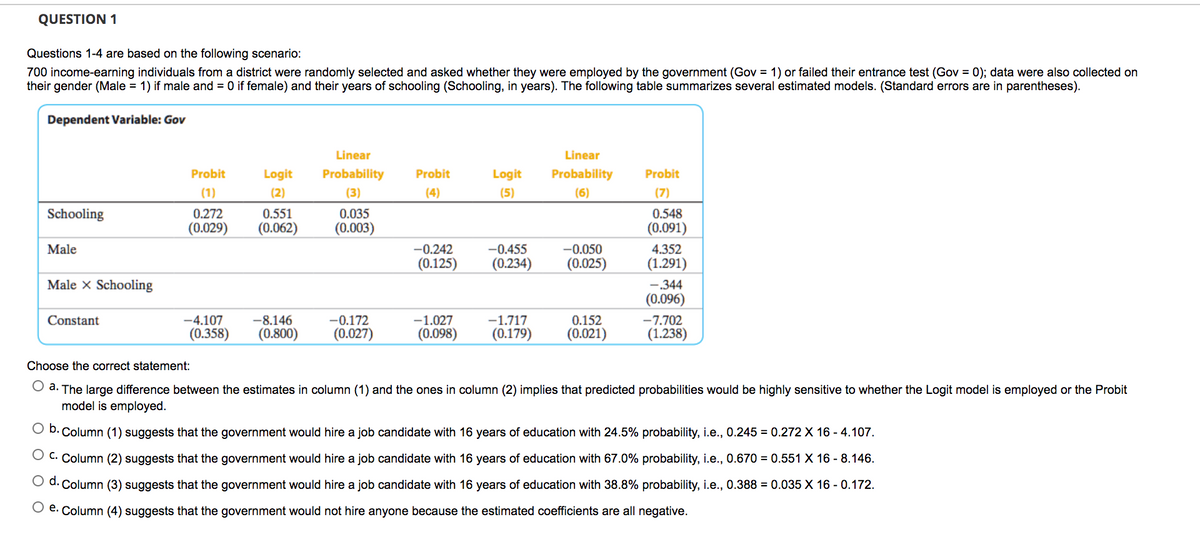
Questions 1-4 are based on the following scenario: 700 income-earning individuals from a district…
A: We are given a sample of 700 income earning individuals, whether or not they are employed by the…
Q: Scenario 4: Does sustained sensory deprivation have any effect on the alpha-wave patterns in the…
A: Statistical tests are used to calculate the test statistic and p-value. This test statistic and…
Q: The accompanying table gives the number of states, s, associated with the national P.T.A…
A: Enter the data in the excel file .
Q: QUESTION 15 A research wants to determine if pre-natal exposure to the hormones in birth control…
A:
Q: Question 3 A manager of an inter-county hurling team is concerned that his team lose matches because…
A: Null Hypothesis: A hypothesis which is tested for plausible rejection is called the null hypothesis…
Q: A new starch polymer foam with high shock absorbent properties is expected to perform better than…
A: Given: Old foam: 1.56J μ=population meanx=sample meann=sample sizes=sample sd We use s one sample…
Q: A possible important environmental determinant of lung function in children is the amount of…
A: Let X1 represents Group 1 X2 represents the group 2 The provided sample means are shown below:…
Q: Consider an equation to explain salaries of CEOs in terms of annual firm sales, return on equity…
A: Given:Multiple regression equation is,log (salary)=4.32+0.28 log (sales)+0.017…
Q: Four hundred driver's license applicants were randomly selected and asked whether they passed their…
A:
Q: Consider the following time series data for the real consumption of households and government, at…
A: We are given a time series data for the real consumption of household and government, at current…
Q: EEK 2 5 7 9. ALLS 50 35 25 40 45 35 20 30 35 EEK 13 14 15 16 17 18 19 20 21 ALLS 55 35 25 55 55 40…
A: *Answer: In exponential smoothing , Ft=Ft-1+alpha *(At-1-Ft-1) ,alpha =smoothing constant At-1 :…
Q: table 3 gives the actual sales, log of sales, and changes in the log of sales of Cisco Systems for…
A: Solution is given below
Q: Question 1 The manager of the city pool has scheduled extra lifeguards to be on staff for Saturdays.…
A: The categorical variable is Swimmers at the City Pool. A sample of 5 observations is given. We have…
Q: QUESTION 28 A research wants to determine if pre-natal exposure to the hormones in birth control…
A:
Q: The following three equations were estimated using the 1,534 observations in 401K.RAW: prate = 80.29…
A: The coefficient of determination and adjusted R2 for first regression is 0.100 and 0.098,…
Q: QUESTION 3 Which of the following statements is correct? a.A finite distributed lag (FDL) model is…
A: The answer is as follows:
Q: Example 17-11. (a) Show that if a most efficient estimator A and a less efficient estimator B with…
A:
Q: QUESTION 1 In a certain village accidents occur infrequently. It is known that the probability of an…
A: Note: Since you have posted multiple independent questions in the same request, we will solve the…
Q: claim that the proportion of people who are confident is larger than 60% at the 0.10 significance…
A: Given : n=100 , p-hat=0.61 , p0=0.60 , α=0.10 We want to test the claim that the proportion of…
Q: Given the following two models, log C = ß1 + BzlogGD; + û¡ and logG = B1 + BzlogGl; + û use…
A:
Step by step
Solved in 2 steps
- Question 1 The average age in a sample of 190 students at City College is 22. As a result of this sample, it can be concluded that the average age of all the students at City College Question 1 options: must be more than 22, since the population is always larger than the sample is 22 since the sample mean is an unbiased estimator of the population mean could be larger, smaller, or equal to 22 must be less than 22, since the sample is only a part of the populationRework problem 23 in section 6.3 of your textbook (page 276) except use the following data instead of the data in the textbook: Assume that the production of 1 unit of magnesium requires 0.2 units of magnesium and 0.3 units of aluminum, and that the production of 1 unit of aluminum requires 0.2 units of magnesium and 0.8 units of aluminum.Find the production schedule that satisfies an external demand for 30 units of magnesium and 60 units of aluminum. Rework problem 23 in section 6.3 of your textbook (page 276) except use the following data instead of the data in the textbook: Assume that the production of 1 unit of magnesium requires 0.2 units of magnesium and 0.3 units of aluminum, and that the production of 1 unit of aluminum requires 0.2 units of magnesium and 0.8 units of aluminum. Please look at attched image and show steps to solve for solutionQUESTION 3 The Research Unit for Cecilion Supermart conducted an experiment to estimate the strength of thecarrier bag from the starch-based biofilms made from two different jicamas (sengkuang) of type Aand type B. However, the researcher claims that jicama type A produces more strength comparedto type B. To support this claim, 10kg weight item was put into 100 carrier bags made from jicamatype A and 200 carrier bags made from jicama type B were randomly selected. As a result, 8 bagsfrom jicama type A burst while 12 bags from jicama type B burst. Calculate a 95% confidenceinterval for the difference in true proportion of the carrier bags which burst between jicama type Aand type B. Give comment on the parameter estimate.
- Question 23: The National Institute of Mental Health published an article stating that in any one-year period, approximately 9% of American adults suffer from depression or a depressive illness. Suppose that in a survey of 2000 people in a certain city, 10% of them suffered from depression or a depressive illness. Conduct a hypothesis test to determine if the true proportion of people in that city suffering from depression or a depressive illness is more than the 9% in the general adult American population. Test the relevant hypotheses using a 10% level of significance. Give answer to at least 4 decimal places. What are the correct hypotheses? (Select the correct symbols and use decimal values not percentages.) H0: H1: Based on the hypotheses, find the following: Test Statistic = p-value = Based on the above we choose to The correct summary would be: that the true proportion of people in that city suffering from depression or a…Calculate the PRESS statistic for the model developed from the estimation data in Problem 11.2. How well is the model likely to predict? Compare this indication of predictive performance with the actual performance observed in Problem 11.2.What would be my research hypothesis for this scenario?
- Questions 4-5 deal with the following information: GloboSnax has an overall 10% success rate when introducing new products. (Suppose success here means a product achieves a certain target market share within 2 years of its introduction.) Before roll-out, a secret forecasting committee assesses each new product, and calls it a “winner” or “loser.” In the past, the committee has done reasonably well in distinguishing between successful and unsuccessful products: 90% of products that went on to succeed were correctly called “winners” by the committee. 70% of products that went on to fail were correctly called “losers” by the committee. A new product, CocoChips is evaluated and labeled a “winner” by the committee. 4. Based on the information available, calculate the probability that CocoChips will succeed, given the “winner” classification from the forecasting committee. (Hint: you can use a 2x2 table, and/or Bayes Rule formula to help compute your answer.) 5. What would be a…Question No. 4: According to the All Pakistan Software Developer Association (APSDA), developers generally spend more than 40 hours each week working on software and web development. The Table 4.1 shows the number of hours worked per week for a sample of 15 Software developers and a sample of 10 Web developers. Table 4.1 Software Developers 56 54 54 49 61 48 58 60 59 53 50 58 55 57 52 Web Developers 47 50 46 47 48 49 46 55 44 42 ---- a) What is the third quartile of spending working hours for Software developers? b) Create a box plot for the number of hours worked for Software developers. c) Create a box plot for the number of hours worked for Web developers. d) Comment on the differences between the box plots for Software & Web developers.Question 18: Let YY represent the profit (or loss) for a certain company XX years after 1960. Based on the data shown below, a statistician calculates a linear model Y=0.54X+5.85Y=0.54X+5.85. x y 4 7.78 5 9.2 6 8.72 7 9.14 8 9.86 9 12.48 10 11.3 11 10.52 12 12.44 13 11.56 14 13.68 15 14.4 16 14.72 17 14.64 18 15.66 19 16.08 Use the model to estimate the profit in `1965y =
- Question 4a. A large accountancy firm finds that over the long run 10% of its statements for clients are in error in some way. A quality assurance officer at the firm investigating the source of the errors takes a sample of 20 statements produced by a single employee and classifies each as being “in error” or “not in error”.i. If the variable X is used to represent the number of statements in the sample that are in error, and assuming the error rate is the firm’s level of 10% then state:• the type of distribution this variable has; and• the parameter/s of this distribution. ii. Determine the probability that 2 or less returns in this sample are in error. The quality assurance officer found that there were 5 statements in the sample that were in error.iii. Determine the probability of finding 5 or more returns in error if indeed the error rate was 10%. iv. Based upon your answer for part iii., what conclusion might the quality assurance office make about this employee in terms of the…Question 1 The UWI Open Campus has commissioned a study to determine how student will perform in ECON3080 based on the hours of studying each semester. Students are separated by gender and the results of the study are given below: Males Females Hours Studying ECON3080 Grade Hours Studying ECON3080 Grade 377 92 182 51 280 100 99 41 187 99 44 38 225 62 387 90 157 91 200 75 280 99 331 48 80 32 263 78 374 88 377 93 141 59 297 49 385 72 229 88 238 30 254 80 105 94 347 80 180 53 119 55 288 48 142 67 241 96 293 45 72 57 318 36 314 82 319 94 196 81 60 60 209 79 319 42 306 79 184 81 167 51 193 56 380 44 239 34 389 88 144 49 122 49 97 100 354 76 337…Question 5: A college is interested in if the year of receiving high-level education (college and above) influences students’ salaries when they join the working field. The college randomly selected 4 students who recently received a full- time work offer and collected their year of receiving high-level education and salary per week. The raw data is: Participant Year of high-level education Salary per week Participant 1 4 1150 Participant 2 5 1300 Participant 3 7 1600 Participant 4 2 750 Plot the scatterplot and label the participants. Calculate the correlation coefficient between the year of high-level education and salary per week. Calculate the regression equation using the year of receiving high-level education to predict the salary per week. If a student graduate from college and graduate school in a total of 6 years, what is this student’s predicted salary per week?