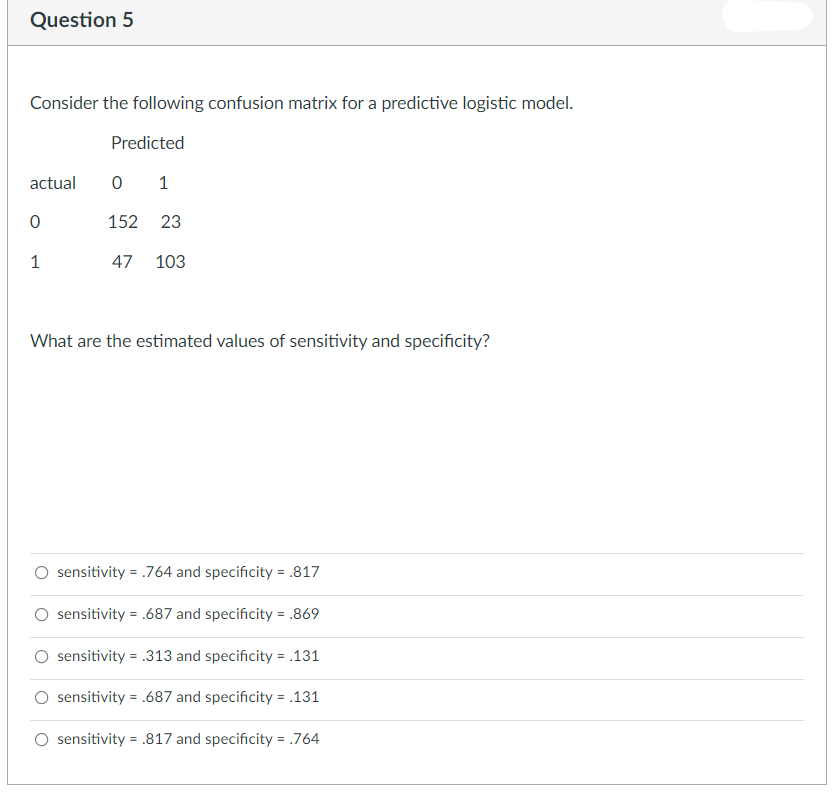
Question 5 Consider the following confusion matrix for a predictive logistic model. Predicted actual 152 23 1 47 103 What are the estimated values of sensitivity and specificity?


Q: Question 1A Complete the following table by finding cf and C Data (x) Frequency (f)…
A: Frequency distribution table : A statistical distribution table may be a graph that shows the…
Q: Step 2 of 3: Find the first quartile.
A: Arrange the data in ascending order. S.no. X 1 41 2 43 3 44 4 46 5 48 6 50 7 54…
Q: Consider the following regression estimate: In Qd = 2.1 – 0.7 ln P + 0.07Urban Log quantity demanded…
A: Given Information: Regression estimate ln Q^d=2.1-0.7 ln P+0.07Urban The dependent variable is…
Q: Question 4 Refer to Problem 2. Fill in the SSTR value in the table. 85 105 90 Question 5 Refer to…
A: ANOVA : Analysis of variance is a technique to find out the significant difference between the mean.…
Q: In logistic regression, the outcome variable is: Question 10 options: Independent There is…
A: Binary variables has two categories of 0 and 1. Where o indicates 'not happen' and 1 indicates…
Q: Question 18 For an initial cell population of 3,000,000 use the given Logistic Function to find the…
A: Logistic model
Q: The following table gives the U.S. population, ages 20–64, (in millions) for selected years from…
A: From the given data, Year Number of years after 1950 U.S. population (in millions) ages 20–64…
Q: The following are assumptions of the logistic model: No immigration or emigration а. O b. 1>1 No…
A: Logistic model is a type of continuous distribution. It has two parameters they are location and…
Q: The last 15 months of sales data are given below: Jan Feb Mar Apr May 2020 13.7 14.7 14.8 13 14 2021…
A: The value of variable Yt for each value corresponding to Xt is as follows Month Xt Yt Jan-20…
Q: In 2009, 2012, and 2015, the number (in millions) of smart phones sold in the world was 172.4,…
A:
Q: 1. The population data of a city for the past 20 years was recorded in the Table as shown below.…
A:
Q: 4. Consider the following survival tables relative two survival data of a clinical trial where…
A: Hii
Q: Question 2: Logistic Regression For questions 9 - 11, use the model below where the data contains…
A:
Q: 5.1 #1 The graph below shows a plot of the total number E of Ebola cases in West Africa reported to…
A: Given - The graph below shows a plot of the total number E of Ebola cases in West Africa reported to…
Q: The figures below repesenting deer density and seasonal death rate demonstrate which one of the…
A: It is an important part of statistics. It is widely used.
Q: Suppose the equation estimated using data is: log(rent) = .043 + .066 log(pop)+ .507 log(avginc) +…
A: “Since you have asked multiple questions, we will solve the first question for you. If you want any…
Q: Question 8 Suppose 14 blackberry plants started growing in a yard. Absent constraint, the blackberry…
A:
Q: The population of the United States has grown at different rates over ten-year increments as shown…
A: According to the given information, Maximum supportable population of US = 600 million
Q: Draw the phase lines of the logistic models, if the parameters are given as: (i) a= 0.096 and…
A: note : As per the convention we will use the following standard definition of the logistic model…
Q: our company just became international by offering its products in both the United States and Canada.…
A:
Q: Suppose the equation estimated using data is: log(rent) = .043 + .066 log(pop) + .507 log(avginc) +…
A: Please note that as per our guidelines if multiple questions are posted we can answer the first…
Q: Question 4 In a study of the relationship between real aggregate consumption and prices in a…
A:
Q: Consider a simple model to explain a country’s alcohol related automobiles incidents (totaai) in…
A:
Q: Question 18 For an initial cell population of 8,000,000 use the given Logistic Function to find the…
A: We need to find population of cells after 2 hours from given logistics model
Q: Questions 1-4 are based on the following scenario: 700 income-earning individuals from a district…
A: We are given a sample of 700 income earning individuals, whether or not they are employed by the…
Q: Question 1: The population size x(t) in the logistic equation dx = x(1 – 0.04x). dt is evaluated…
A: Introduction: The logistic growth equation is a model that describes the population dynamics. It is…
Q: lease give full solution 1. Exhibit 9-3. Simmons owns and operates a national chain of department…
A: Option b) is correct. The log odds is given by odds = -2.5 + 0.33 x 3 + 2.1 x 0odds = -1.51 The…
Q: Imagine you conducted a study to look at the association between whether expectant mothers in two…
A: The given information is age groups , eat breakfast (or not) and the Gender of the first born…
Q: 19) You run cross validation using the Caret package and get the following output. model log$results…
A: 19) Given cross validation output, From the given output, the accuracy indicates the average…
Q: Question 2) The following regression model will be estimated according to the data of real…
A: Given information: The data represents the values of the variables real consumption expenditure,…
Q: Four hundred driver's license applicants were randomly selected and asked whether they passed their…
A:
Q: Question 11 The data below give the amount of money spent on fast food by 14 individuals over a one…
A:
Q: Question 5 Identify whether the below data for the given variable would be discrete or continuous.…
A: The variable are given and objective is to find the if they are discrete or continuous.
Q: The population of the United States has grown at different rates over ten-year increments as shown…
A: In 1930 the population was 123.1 million and in 1940 the population was 131.1 million.So, the…
Q: Question 7 Indicate for each statement whether it is correct or incorrect. Correct Incorrect In a…
A: We have given the statement about multivariate regression model.
Q: Question 8 Examining the below R output, explain what model was selected for forecasting? Model: LM…
A: Given problem Given that
Q: table 3 gives the actual sales, log of sales, and changes in the log of sales of Cisco Systems for…
A: Solution is given below
Q: The following table shows world population N, in billions, in the given year. According to the…
A: Given: The logistic model is given by, N=10.901+2.23e-0.030t ... (1)
Q: Review the table of values. x y 1 10 4 5 5 3.5 7 2 10 1.5 Which description best fits…
A: We know that Regression works with the Principal of Least Squares. i.e. Minimising Sum of Squares of…
Q: QUESTION 4 Continue to use the information from Question 1. Choose the correct statement about…
A: Answer 1 Correct Option : The large difference between the estimates in column(1) and the ones in…
Q: Sam was 29 inches tall on her 1st birthday, 51 inches tall on her 8th, and 63 inches tall on her…
A:
Q: QUESTION 1 Assume that sales for year “n" were 12 units and a forecast of sales for that year had…
A: Given, α = 0.6 By exponential smoothing method,the forecast value(Ft) = Ft-1 + α(At-1 - Ft-1)
Q: a) A wedding photographer has made $500 on average in the 5 years it has been operational. When 12…
A: Hello. Since your question has multiple sub-parts, we will solve first three sub-parts for you. If…
Q: QUESTION 5 Given the following data: YX 08 16 09 14 13 is B (the slope of the logistic curve)…
A: Data given Y: 0,1,0,1,1 X: 8,6,9,4,3
Q: QUESTION 3 Which of the following statements is correct? a.A finite distributed lag (FDL) model is…
A: The answer is as follows:
Q: Can gender, educational level, and age predict the odds that someone votes for a particular…
A: Since you have posted a question with multiple sub-parts, we will solve first three sub-parts for…
Q: The population of the United States has grown at different rates over ten-year increments as shown…
A: Given data Year Population of U.S. 1930 123.1 million 1940 132.1 million 1950 152.3…
Q: A survey of high school students on Y = whether the subject has driven a motor vehicle after…
A: Given information: The response variable is Y = Whether the subject has driven a motor vehicle after…
Q: The following data represent the population of a country An ecologist is interested in building a…
A:
Q: 5. Consider the OLS estimator of a model to explain the stock prices of a FTSE 100 company using 120…
A: Given regression model: Here, stock t is the stock price Profit t is the profit before tax in…

Step by step
Solved in 2 steps with 1 images

- What does the y -intercept on the graph of a logistic equation correspond to for a population modeled by that equation?Cable TV The following table shows the number C. in millions, of basic subscribers to cable TV in the indicated year These data are from the Statistical Abstract of the United States. Year 1975 1980 1985 1990 1995 2000 C 9.8 17.5 35.4 50.5 60.6 60.6 a. Use regression to find a logistic model for these data. b. By what annual percentage would you expect the number of cable subscribers to grow in the absence of limiting factors? c. The estimated number of subscribers in 2005 was 65.3million. What light does this shed on the model you found in part a?World Population The following table shows world population N, in billions, in the given year. Year 1950 1960 1970 1980 1990 2000 2010 N 2.56 3.04 3.71 4.45 5.29 6.09 6.85 a. Use regression to find a logistic model for world population. b. What r value do these data yield for humans on planet Earth? c. According to the logistic model using these data, what is the carrying capacity of planet Earth for humans? d. According to this model, when will world population reach 90 of carrying capacity? Round to the nearest year. Note: This represents a rather naive analysis of world population.
- What situations are best modeled by a logistic equation? Give an example, and state a case for why the example is a good fit.Olympic Pole Vault The graph in Figure 7 indicates that in recent years the winning Olympic men’s pole vault height has fallen below the value predicted by the regression line in Example 2. This might have occurred because when the pole vault was a new event there was much room for improvement in vaulters’ performances, whereas now even the best training can produce only incremental advances. Let’s see whether concentrating on more recent results gives a better predictor of future records. (a) Use the data in Table 2 (page 176) to complete the table of winning pole vault heights shown in the margin. (Note that we are using x=0 to correspond to the year 1972, where this restricted data set begins.) (b) Find the regression line for the data in part ‚(a). (c) Plot the data and the regression line on the same axes. Does the regression line seem to provide a good model for the data? (d) What does the regression line predict as the winning pole vault height for the 2012 Olympics? Compare this predicted value to the actual 2012 winning height of 5.97 m, as described on page 177. Has this new regression line provided a better prediction than the line in Example 2?In logistic regression, the outcome variable is: Question 10 options: Independent There is no outcome variable Categorical Continuous
- Can gender, educational level, and age predict the odds that someone votes for a particular candidate in the election? Over 1500 voters were selected, and data were col-lected on the highest year of school completed, their age, and their gender. We wish to t a logistic regression model: log(1 p p ) = 0 + 1Age + 2Education + 3Gender, where p is the binomial probability that a person voted for candidate Johnson, and gender is coded as the indicator for female. The R output is given below. parameter df estimate s.e z p-value (Intercept) 1 .1119 .3481 .321 .748 Age 1 .0020 .0032 .613 .54 Education 1 -.0100 .0184 .547 .585 Gender 1 .4282 .1040 4.117 .000 Null deviance: 255.95 on 1499 degrees of freedom Residual deviance: 220.80 on 1496 degrees of freedom Write down the tted logistic regression and give a short summary about the data analysis . Calculate the probability of voting for Johnson for a…When conducting a logistic regression analysis, what is the problem of class imbalance in a dataset? Question 2 options: When the number of observations in one class is too similar to the number of observations in the other class When the number of observations in one class exactly equals the number of observations in the other class. When the number of observations in one class is substantially smaller than the number of observations in the other class When the number of observations in one class does not exactly equal the number of observations in the other classQuestion 6 Having studied Fixed Income Securities, you are now working as an analyst for a well known bond fund. Your manager asks you to replicate the JP Morgan T-Bond Index using a tracking error minimization approach. You are to replicate this index as closely as possible using a medium duration Treasury bond (M-BOND) and a long duration Treasury bond (L-BOND). These expire in approximately 7.15 years’ and 29.25 years’ time respectively. The following variance-covariance matrix, based on daily returns over the preceding six months, is given to you to use in your replication: Note: As usual, variances are given on the diagonal, e.g. the variance of M-BOND is 0.0042%. As usual, covariances appear in the non-diagonal elements, e.g. the covariance of M-BOND and L-BOND is 0.0057%. (a) Suppose the optimal weights for M-BOND and L-BOND are 0.7 and 0.3. Calculate the expected tracking error of the portfolio and explain how you interpret this number. (b) Calculate the correlation matrix…
- Scenario: You conduct research to assess the extent to which regulatory reports are late (in days). As potential contributors to late reports you want to simultaneously investigate company site (MN, CA, NY, TX), reporting agency (Agencies 1, 2, and 3), and report format (Long form, Short form) . What research analysis would be most appropriate? Group of answer choices a. ANOVA b. Binary Logistic Regression c. Chi-square Contingency Table d. Non-parametric e. RegressionConsider a simple logistic model in which the response variable is attendance at a conference (yes = 1; no = 0), and the sole independent variable is a college degree (degree = 1; no degree = 0). The estimated odds ratio for the college degree variable is 1.25. What is its proper interpretation?Question 3. Answer “YES “ or “No” to the following questions a. In ANOVA completely randomized design if you have more than two missing values, Analysis Toolpak in EXCEL will calculate F.YESNO b. In ANOVA you cannot use log transformed values if there are “zeros” in the data YESNo c. In ANOVA correction term can be larger than ƩY2 YESNO d. In ANOVA , my calculated F value was – 23.4. This is perfectly OK.YESNO e. In ANOVA, my raw data was multiplicative and so I log-transformed them and it became additive. Is this procedure correct? YESNO


