QUESTION 9 Compare and contrast the output gap before and after 1980 and select the statement that best describes the difference between the two periods. O The average output gap before 1980 is higher (around zero) than after 1980 (around -2.5 percent) O The output gap after 1980 takes longer to return to zero than it did before 1980 O The output gap is always positive when the economy is in an expansion (white regions of the graph). O Answers (a) and (b) O None of the above
QUESTION 9 Compare and contrast the output gap before and after 1980 and select the statement that best describes the difference between the two periods. O The average output gap before 1980 is higher (around zero) than after 1980 (around -2.5 percent) O The output gap after 1980 takes longer to return to zero than it did before 1980 O The output gap is always positive when the economy is in an expansion (white regions of the graph). O Answers (a) and (b) O None of the above

Survey of Economics (MindTap Course List)
9th Edition
ISBN:9781305260948
Author:Irvin B. Tucker
Publisher:Irvin B. Tucker
Chapter11: Gross Domestic Product
Section: Chapter Questions
Problem 13SQ

Related questions
Question
What is the correct option for answer 9
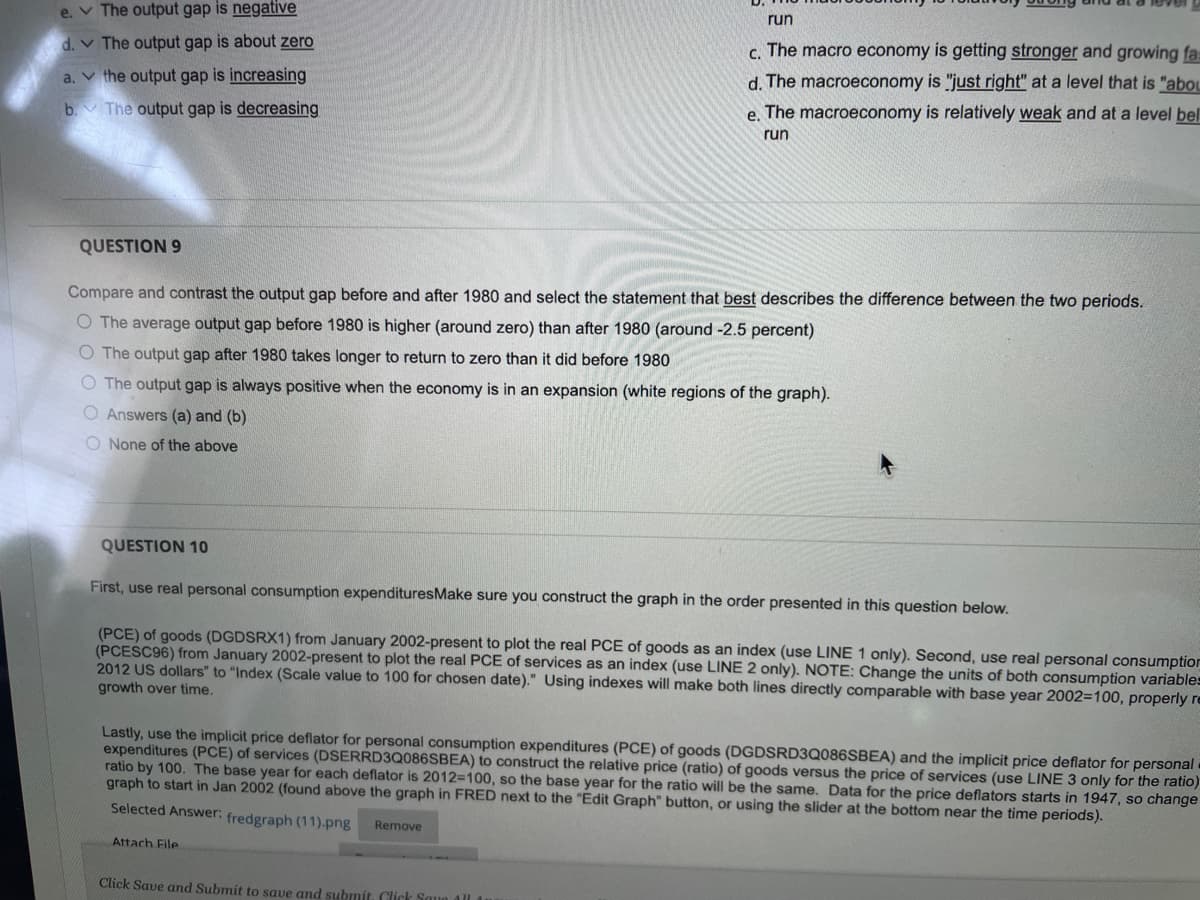
Transcribed Image Text:e. The output gap is negative
The output gap is about zero
d.
a.
the output gap is increasing
b.
The output gap is decreasing
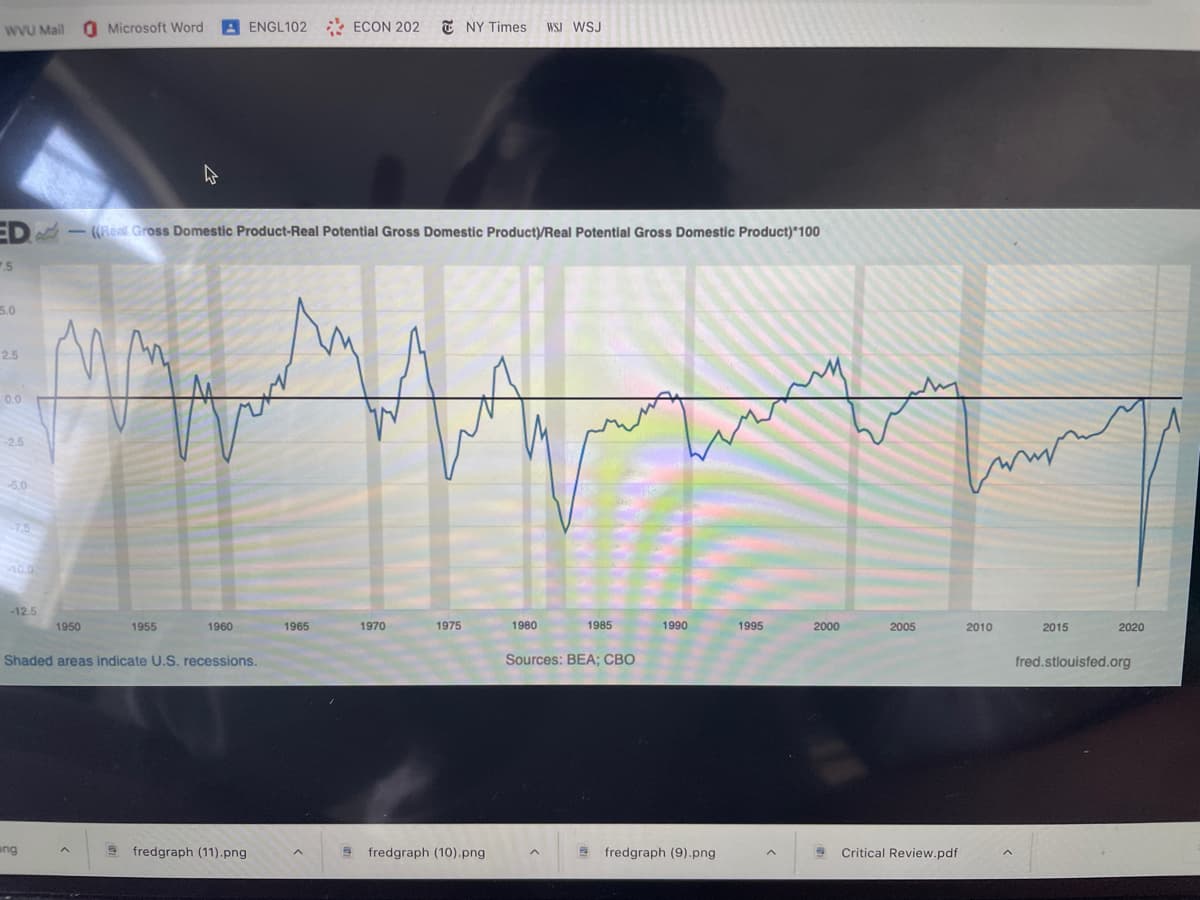
QUESTION 9
Compare and contrast the output gap before and after 1980 and select the statement that best describes the difference between the two periods.
O The average output gap before 1980 is higher (around zero) than after 1980 (around -2.5 percent)
O The output gap after 1980 takes longer to return to zero than it did before 1980
O The output gap is always positive when the economy is in an expansion (white regions of the graph).
O Answers (a) and (b)
O None of the above
run
c. The macro economy is getting stronger and growing fa
d. The macroeconomy is "just right" at a level that is "abou
e. The macroeconomy is relatively weak and at a level bel
run
QUESTION 10
First, use real personal consumption expenditures Make sure you construct the graph in the order presented in this question below.
(PCE) of goods (DGDSRX1) from January 2002-present to plot the real PCE of goods as an index (use LINE 1 only). Second, use real personal consumption
(PCESC96) from January 2002-present to plot the real PCE of services as an index (use LINE 2 only). NOTE: Change the units of both consumption variables
2012 US dollars" to "Index (Scale value to 100 for chosen date)." Using indexes will make both lines directly comparable with base year 2002=100, properly re
growth over time.
Lastly, use the implicit price deflator for personal consumption expenditures (PCE) of goods (DGDSRD3Q086SBEA) and the implicit price deflator for personal
expenditures (PCE) of services (DSERRD3Q086SBEA) to construct the relative price (ratio) of goods versus the price of services (use LINE 3 only for the ratio)
ratio by 100. The base year for each deflator is 2012-100, so the base year for the ratio will be the same. Data for the price deflators starts in 1947, so change
graph to start in Jan 2002 (found above the graph in FRED next to the "Edit Graph" button, or using the slider at the bottom near the time periods).
Selected Answer: fredgraph (11).png Remove
Attach File
Click Save and Submit to save and submit. Click Save All A
Transcribed Image Text:WVU Mail
7.5
5.0
ED-((Real Gross Domestic Product-Real Potential Gross Domestic Product)/Real Potential Gross Domestic Product)*100
2.5
0.0
-2.5
-6.0
7.5
10.0
-12.5
Microsoft Word
1950
ang
1955
W
1960
ENGL102 ECON 202
Shaded areas indicate U.S. recessions.
fredgraph (11).png
1965
1970
NY Times WSJ WSJ
1975
fredgraph (10).png
1980
1985
Sources: BEA; CBO
1990
fredgraph (9).png
1995
2000
2005
Critical Review.pdf
wwww
2010
2015
2020
fred.stlouisfed.org
Expert Solution
This question has been solved!
Explore an expertly crafted, step-by-step solution for a thorough understanding of key concepts.

This is a popular solution!

Trending now
This is a popular solution!

Step by step
Solved in 2 steps with 2 images

Knowledge Booster


Learn more about
Need a deep-dive on the concept behind this application? Look no further. Learn more about this topic, economics and related others by exploring similar questions and additional content below.Recommended textbooks for you
Survey of Economics (MindTap Course List)
Economics
ISBN:
9781305260948
Author:
Irvin B. Tucker
Publisher:
Cengage Learning


Survey of Economics (MindTap Course List)
Economics
ISBN:
9781305260948
Author:
Irvin B. Tucker
Publisher:
Cengage Learning

Economics: Private and Public Choice (MindTap Cou…
Economics
ISBN:
9781305506725
Author:
James D. Gwartney, Richard L. Stroup, Russell S. Sobel, David A. Macpherson
Publisher:
Cengage Learning

Macroeconomics: Private and Public Choice (MindTa…
Economics
ISBN:
9781305506756
Author:
James D. Gwartney, Richard L. Stroup, Russell S. Sobel, David A. Macpherson
Publisher:
Cengage Learning

Brief Principles of Macroeconomics (MindTap Cours…
Economics
ISBN:
9781337091985
Author:
N. Gregory Mankiw
Publisher:
Cengage Learning