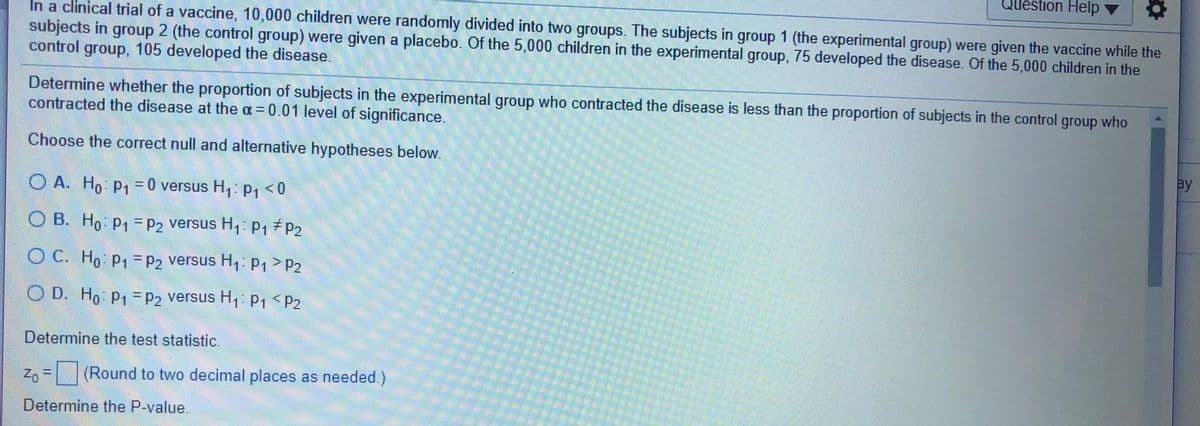
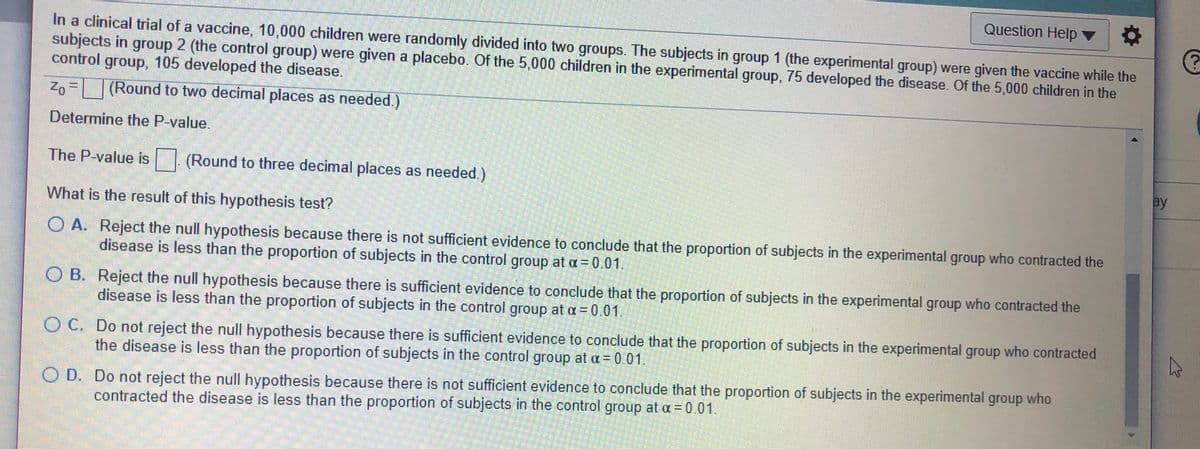
Question Help y In a clinical trial of a vaccine, 10,000 children were randomly divided into two groups. The subjects in group 1 (the experimental group) were given the vaccine while the subjects in group 2 (the control group) were given a placebo. Of the 5,000 children in the experimental group, 75 developed the disease. Of the 5,000 children in the control group, 105 developed the disease. Determine whether the proportion of subjects in the experimental group who contracted the disease is less than the proportion of subjects in the control group who contracted the disease at the a= 0.01 level of significance. Choose the correct null and alternative hypotheses below. O A. Ho: P1 = 0 versus H,: P1 <0 O B. Ho P1 =P2 versus H,: p1 #P2 O C. Ho P1 =P2 versus H,: p1 > P2 O D. Ho: P1 =P2 versus H,: p1

Functions and Change: A Modeling Approach to College Algebra (MindTap Course List)
6th Edition
ISBN:9781337111348
Author:Bruce Crauder, Benny Evans, Alan Noell
Publisher:Bruce Crauder, Benny Evans, Alan Noell
Chapter5: A Survey Of Other Common Functions
Section5.6: Higher-degree Polynomials And Rational Functions
Problem 5E: Population Genetics In the study of population genetics, an important measure of inbreeding is the...
icon
Related questions
icon
Concept explainers
Question
100%

10/12


Question Help
In a clinical trial of a vaccine, 10,000 children were randomly divided into two groups. The subjects in group 1 (the experimental group) were given the vaccine while the
subjects in group 2 (the control group) were given a placebo. Of the 5,000 children in the experimental group, 75 developed the disease. Of the 5,000 children in the
control group, 105 developed the disease.
Determine whether the proportion of subjects in the experimental group who contracted the disease is less than the proportion of subjects in the control group who
contracted the disease at the a = 0.01 level of significance.
Choose the correct null and alternative hypotheses below.
ay
O A. Ho P; = 0 versus H,: p, < 0
B. Ho P1 = P2 versus H, P17P2
O C. Ho P =P2 versus H: P1 > P2
O D. Ho p1-P2 versus H, P, <P2
%3D
Determine the test statistic.
Zo = (Round to two decimal places as needed.)
Determine the P-value.
Transcribed Image Text:Question Help In a clinical trial of a vaccine, 10,000 children were randomly divided into two groups. The subjects in group 1 (the experimental group) were given the vaccine while the subjects in group 2 (the control group) were given a placebo. Of the 5,000 children in the experimental group, 75 developed the disease. Of the 5,000 children in the control group, 105 developed the disease. Determine whether the proportion of subjects in the experimental group who contracted the disease is less than the proportion of subjects in the control group who contracted the disease at the a = 0.01 level of significance. Choose the correct null and alternative hypotheses below. ay O A. Ho P; = 0 versus H,: p, < 0 B. Ho P1 = P2 versus H, P17P2 O C. Ho P =P2 versus H: P1 > P2 O D. Ho p1-P2 versus H, P, <P2 %3D Determine the test statistic. Zo = (Round to two decimal places as needed.) Determine the P-value.
Question Help v
In a clinical trial of a vaccine, 10,000 children were randomly divided into two groups. The subjects in group 1 (the experimental group) were given the vaccine while the
subjects in group 2 (the control group) were given a placebo. Of the 5,000 children in the experimental group, 75 developed the disease. Of the 5,000 children in the
control group, 105 developed the disease.
Zo= (Round to two decimal places as needed.)
Determine the P-value.
The P-value is (Round to three decimal places as needed.)
ay
What is the result of this hypothesis test?
O A. Reject the null hypothesis because there is not sufficient evidence to conclude that the proportion of subjects in the experimental group who contracted the
disease is less than the proportion of subjects in the control group at a = 0,01.
O B. Reject the null hypothesis because there is sufficient evidence to conclude that the proportion of subjects in the experimental group who contracted the
disease is less than the proportion of subjects in the control group at a = 0 01.
O C. Do not reject the null hypothesis because there is sufficient evidence to conclude that the proportion of subjects in the experimental group who contracted
the disease is less than the proportion of subjects in the control group at a = 0.01.
O D. Do not reject the null hypothesis because there is not sufficient evidence to conclude that the proportion of subjects in the experimental group who
contracted the disease is less than the proportion of subjects in the control group at a = 0.01.
Transcribed Image Text:Question Help v In a clinical trial of a vaccine, 10,000 children were randomly divided into two groups. The subjects in group 1 (the experimental group) were given the vaccine while the subjects in group 2 (the control group) were given a placebo. Of the 5,000 children in the experimental group, 75 developed the disease. Of the 5,000 children in the control group, 105 developed the disease. Zo= (Round to two decimal places as needed.) Determine the P-value. The P-value is (Round to three decimal places as needed.) ay What is the result of this hypothesis test? O A. Reject the null hypothesis because there is not sufficient evidence to conclude that the proportion of subjects in the experimental group who contracted the disease is less than the proportion of subjects in the control group at a = 0,01. O B. Reject the null hypothesis because there is sufficient evidence to conclude that the proportion of subjects in the experimental group who contracted the disease is less than the proportion of subjects in the control group at a = 0 01. O C. Do not reject the null hypothesis because there is sufficient evidence to conclude that the proportion of subjects in the experimental group who contracted the disease is less than the proportion of subjects in the control group at a = 0.01. O D. Do not reject the null hypothesis because there is not sufficient evidence to conclude that the proportion of subjects in the experimental group who contracted the disease is less than the proportion of subjects in the control group at a = 0.01.
Expert Solution
trending now

Trending now

This is a popular solution!

steps

Step by step

Solved in 2 steps

Blurred answer
Knowledge Booster
Correlation, Regression, and Association
Learn more about
Need a deep-dive on the concept behind this application? Look no further. Learn more about this topic, statistics and related others by exploring similar questions and additional content below.
Similar questions
Recommended textbooks for you
Functions and Change: A Modeling Approach to Coll…
Algebra
ISBN:
9781337111348
Author:
Bruce Crauder, Benny Evans, Alan Noell
Publisher:
Cengage Learning