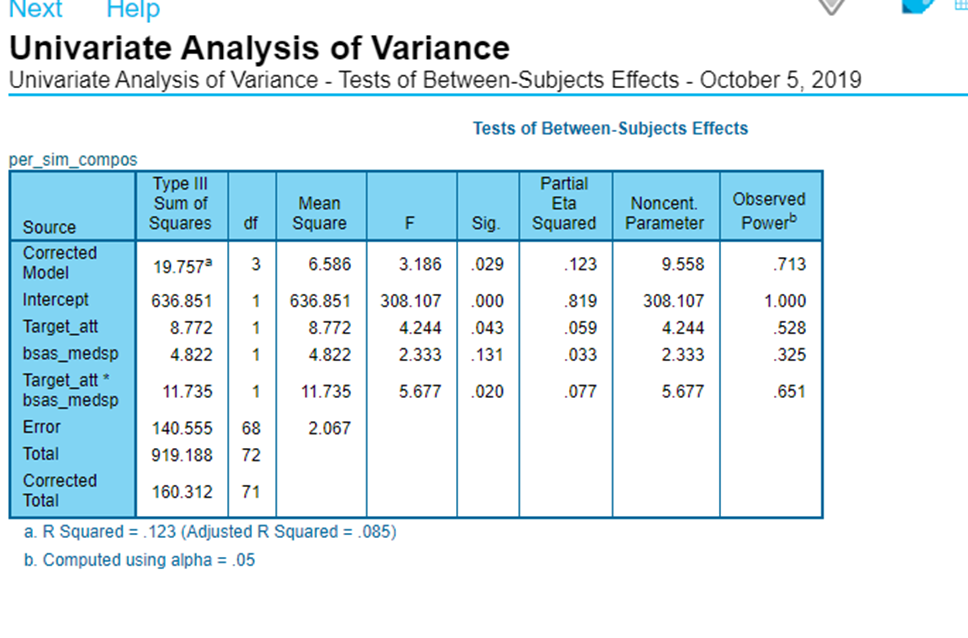
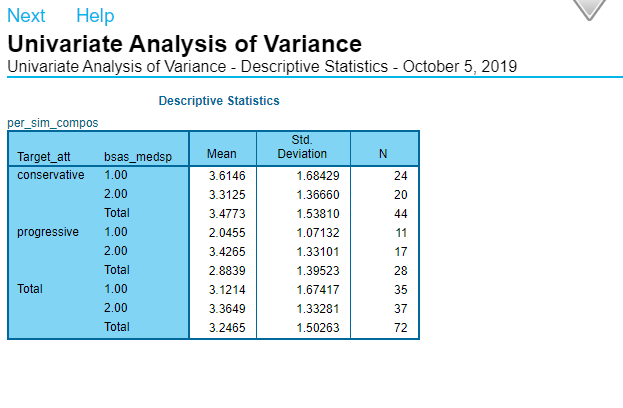
In a pilot study, participants responded to a survey on sexual attitudes (the BSAS). BSAS scores were median-split and participants were assigned to a low BSAS (Sexually Conservative coded a 1) or a high BSAS (Sexually Progressive, coded a 2) group. Participants then read a scenario which described a woman with either sexually conservative or progressive attitudes who is sexually assaulted on a date with a man. Finally, participants responded to a scale with measured the participant's personal similarity to the target. The item responses to this scale were combined into a composite score. What is the results?


Inverse Normal Distribution
The method used for finding the corresponding z-critical value in a normal distribution using the known probability is said to be an inverse normal distribution. The inverse normal distribution is a continuous probability distribution with a family of two parameters.
Mean, Median, Mode
It is a descriptive summary of a data set. It can be defined by using some of the measures. The central tendencies do not provide information regarding individual data from the dataset. However, they give a summary of the data set. The central tendency or measure of central tendency is a central or typical value for a probability distribution.
Z-Scores
A z-score is a unit of measurement used in statistics to describe the position of a raw score in terms of its distance from the mean, measured with reference to standard deviation from the mean. Z-scores are useful in statistics because they allow comparison between two scores that belong to different normal distributions.
In a pilot study, participants responded to a survey on sexual attitudes (the BSAS). BSAS scores were median-split and participants were assigned to a low BSAS (Sexually Conservative coded a 1) or a high BSAS (Sexually Progressive, coded a 2) group. Participants then read a scenario which described a woman with either sexually conservative or progressive attitudes who is sexually assaulted on a date with a man. Finally, participants responded to a scale with measured the participant's personal similarity to the target. The item responses to this scale were combined into a composite score. What is the results?


Trending now
This is a popular solution!

Step by step
Solved in 3 steps


