ratios listed on table a for each year (2020 & 2021): a. For each ratio includes the formula with math computes (2020 & 2021) b. . Fill M&G Industries Ratio Analysis Table A. (2020 & 2021)   II. Perform the following Analysis:   a. Explain each ratio results for 2021 only. b. Compare each ratio performance with the previous year results (compare 2021 results with 2020 results) c. Compare each Ratio results

Cornerstones of Financial Accounting
4th Edition
ISBN:9781337690881
Author:Jay Rich, Jeff Jones
Publisher:Jay Rich, Jeff Jones
Chapter9: Long-term Liabilities
Section: Chapter Questions
Problem 103.4C
icon
Related questions
Question

Instructions:

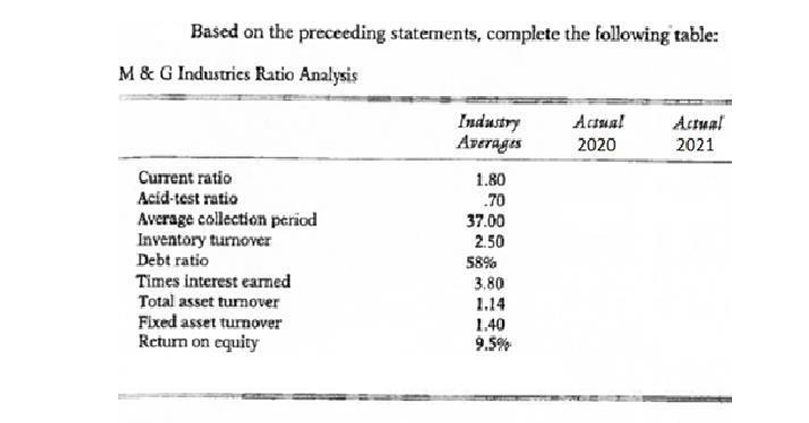
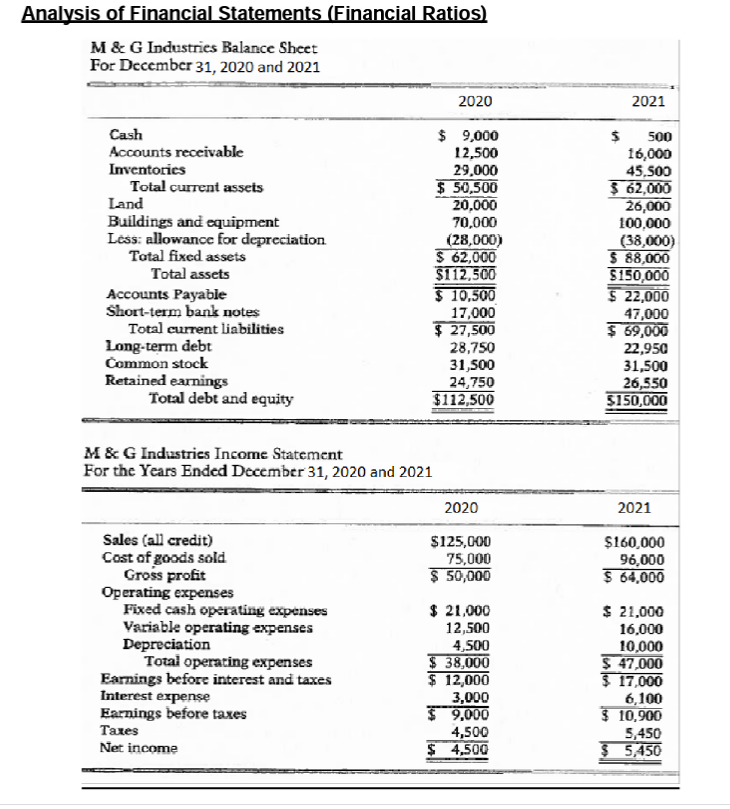
I. Resolve the ratios listed on table a for each year (2020 & 2021):

a. For each ratio includes the formula with math computes (2020 & 2021)

b. . Fill M&G Industries Ratio Analysis Table A. (2020 & 2021)  

II. Perform the following Analysis:  

a. Explain each ratio results for 2021 only.

b. Compare each ratio performance with the previous year results (compare 2021 results with 2020 results)

c. Compare each Ratio results for 2021 with their respective Industry average.  

III. Base on the previous results, evaluate and explain the Company financial position using the following questions:

1. How liquid is the firm?

2. Is management generating adequate operating profits on the firm’s assets?

3. How is the firm financing its assets?

4. Are the owners (stockholders) receiving an adequate return on their investment

Based on the preceeding statements, complete the following table:
M & G Industrics Ratio Analysis
Industry
Averagis
Acsua!
Actual
2020
2021
Current ratio
Acid-test ratio
Average collection period
Inventory turnover
Debt ratio
1.80
.70
37.00
2.50
58%
Times interest earmed
Total asset turnover
Fixed asset turnover
Retum on equity
3.80
1.14
1.40
9.5%
Transcribed Image Text:Based on the preceeding statements, complete the following table: M & G Industrics Ratio Analysis Industry Averagis Acsua! Actual 2020 2021 Current ratio Acid-test ratio Average collection period Inventory turnover Debt ratio 1.80 .70 37.00 2.50 58% Times interest earmed Total asset turnover Fixed asset turnover Retum on equity 3.80 1.14 1.40 9.5%
Analysis of Financial Statements (Financial Ratios)
M & G Industries Balance Sheet
For December 31, 2020 and 2021
2020
2021
Cash
Accounts receivable
Inventories
Total current assets
Land
$ 9,000
12,500
29,000
$ 50,500
20,000
500
16,000
45,500
$ 62,000
26,000
100,000
(38,000)
5 88,000
$150,000
$ 22,000
47,000
$ 69,000
22,950
31,500
26,550
$150,000
Buildings and equipment
Less: allowance for depreciation
Total fixed assets
70,000
(28,000)
$ 62,000
$112,500
$ 10,500
17,000
$ 27,500
28,750
31,500
24,750
$112,500
Total assets
Accounts Payable
Short-term bank notes
Total current liabilities
Long-term debt
Common stock
Retained earnings
Total debt and equity
M&G Industrics Income Statement
For the Years Ended December 31, 2020 and 2021
2020
2021
Sales (all credit)
Cost of goods sold
Gross profit
Operating expenses
Fixed cash operating expenses
Variable operating expenses
Depreciation
Total operating expenses
Earnings before interest and taxes
Interest expense
Earnings before taxes
$125,000
75,000
$ 50,000
$160,000
96,000
$ 64,000
$ 21,000
12,500
4,500
$ 38,000
$ 12,000
3,000
9,000
$ 21,000
16,000
10,000
$ 47,000
§ 17,000
6,100
§ 10,900
5,450
$ 5,450
Taxes
4,500
Net income
$ 4,500
Transcribed Image Text:Analysis of Financial Statements (Financial Ratios) M & G Industries Balance Sheet For December 31, 2020 and 2021 2020 2021 Cash Accounts receivable Inventories Total current assets Land $ 9,000 12,500 29,000 $ 50,500 20,000 500 16,000 45,500 $ 62,000 26,000 100,000 (38,000) 5 88,000 $150,000 $ 22,000 47,000 $ 69,000 22,950 31,500 26,550 $150,000 Buildings and equipment Less: allowance for depreciation Total fixed assets 70,000 (28,000) $ 62,000 $112,500 $ 10,500 17,000 $ 27,500 28,750 31,500 24,750 $112,500 Total assets Accounts Payable Short-term bank notes Total current liabilities Long-term debt Common stock Retained earnings Total debt and equity M&G Industrics Income Statement For the Years Ended December 31, 2020 and 2021 2020 2021 Sales (all credit) Cost of goods sold Gross profit Operating expenses Fixed cash operating expenses Variable operating expenses Depreciation Total operating expenses Earnings before interest and taxes Interest expense Earnings before taxes $125,000 75,000 $ 50,000 $160,000 96,000 $ 64,000 $ 21,000 12,500 4,500 $ 38,000 $ 12,000 3,000 9,000 $ 21,000 16,000 10,000 $ 47,000 § 17,000 6,100 § 10,900 5,450 $ 5,450 Taxes 4,500 Net income $ 4,500
Expert Solution
steps

Step by step

Solved in 2 steps

Blurred answer
Knowledge Booster
Balance Sheet Analysis
Learn more about
Need a deep-dive on the concept behind this application? Look no further. Learn more about this topic, accounting and related others by exploring similar questions and additional content below.
Similar questions
Recommended textbooks for you
Cornerstones of Financial Accounting
Accounting
ISBN:
9781337690881
Author:
Jay Rich, Jeff Jones
Publisher:
Cengage Learning
Intermediate Accounting: Reporting And Analysis
Accounting
ISBN:
9781337788281
Author:
James M. Wahlen, Jefferson P. Jones, Donald Pagach
Publisher:
Cengage Learning
Fundamentals Of Financial Management, Concise Edi…
Finance
ISBN:
9781337902571
Author:
Eugene F. Brigham, Joel F. Houston
Publisher:
Cengage Learning
Survey of Accounting (Accounting I)
Accounting
ISBN:
9781305961883
Author:
Carl Warren
Publisher:
Cengage Learning