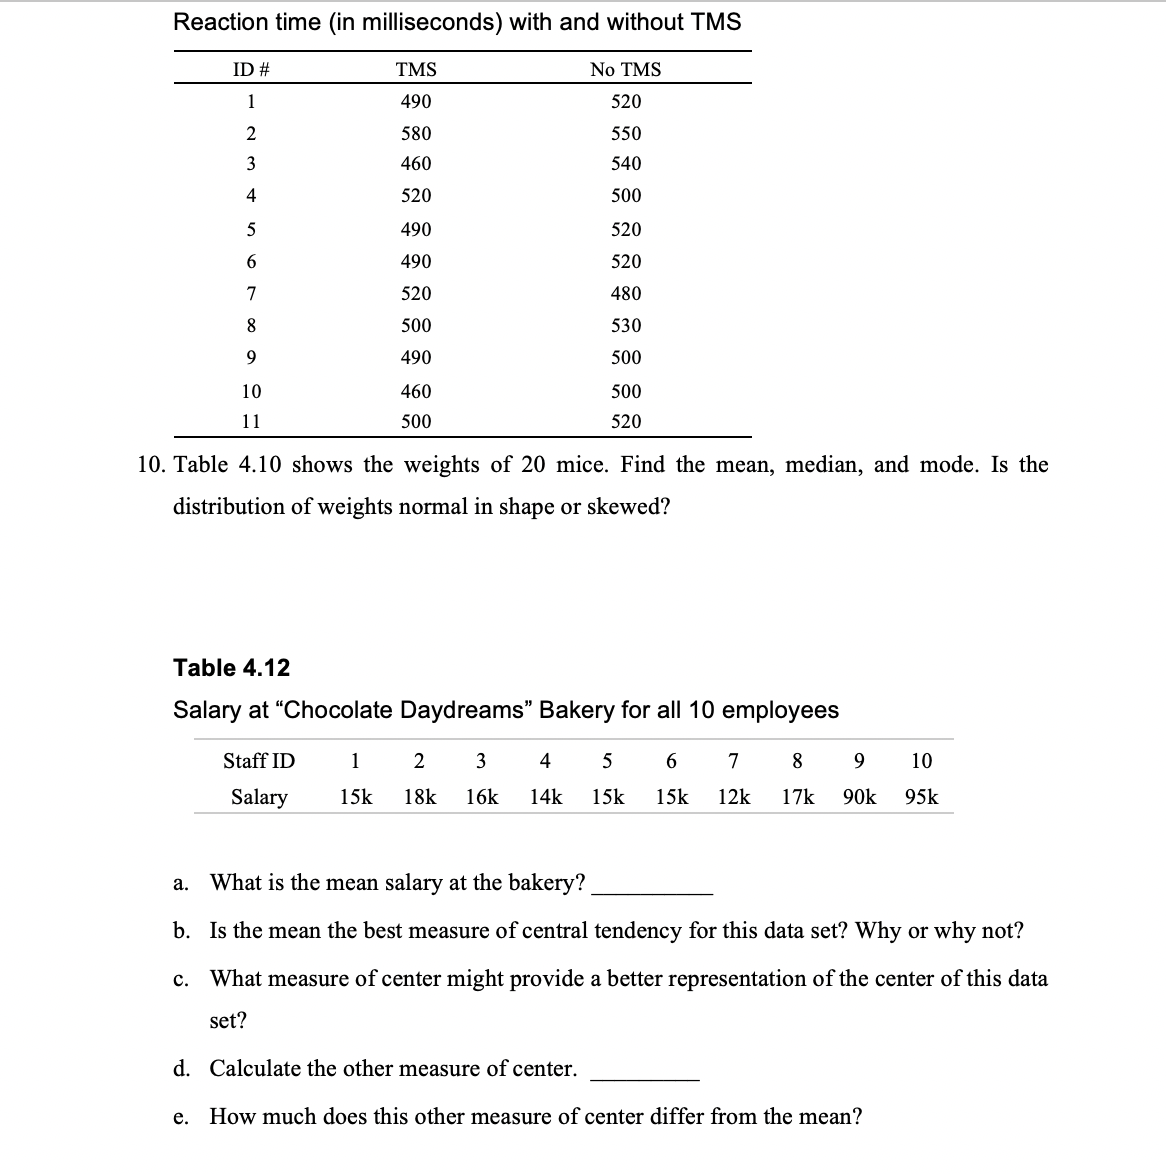
Reaction time (in milliseconds) with and without TMS ID # TMS No TMS 1 490 520 580 550 3 460 540 4 520 500 5 490 520 490 520 7 520 480 8 500 530 490 500 10 460 500 11 500 520 0. Table 4.10 shows the weights of 20 mice. Find the mean, median, and mode. Is the distribution of weights normal in shape or skewed? Table 4.12 Salary at "Chocolate Daydreams" Bakery for all 10 employees Staff ID 1 2 3 4 5 6. 7 8 9. 10 Salary 15k 18k 16k 14k 15k 15k 12k 17k 90k 95k a. What is the mean salary at the bake b. Is the mean the best measure of central tendency for this data set? Why or why not? c. What measure of center might provide a better representation of the center of this data set? d. Calculate the other measure of center. e. How much does this other measure of center differ from the mean?


Inverse Normal Distribution
The method used for finding the corresponding z-critical value in a normal distribution using the known probability is said to be an inverse normal distribution. The inverse normal distribution is a continuous probability distribution with a family of two parameters.
Mean, Median, Mode
It is a descriptive summary of a data set. It can be defined by using some of the measures. The central tendencies do not provide information regarding individual data from the dataset. However, they give a summary of the data set. The central tendency or measure of central tendency is a central or typical value for a probability distribution.
Z-Scores
A z-score is a unit of measurement used in statistics to describe the position of a raw score in terms of its distance from the mean, measured with reference to standard deviation from the mean. Z-scores are useful in statistics because they allow comparison between two scores that belong to different normal distributions.


Trending now
This is a popular solution!

Step by step
Solved in 2 steps with 9 images


