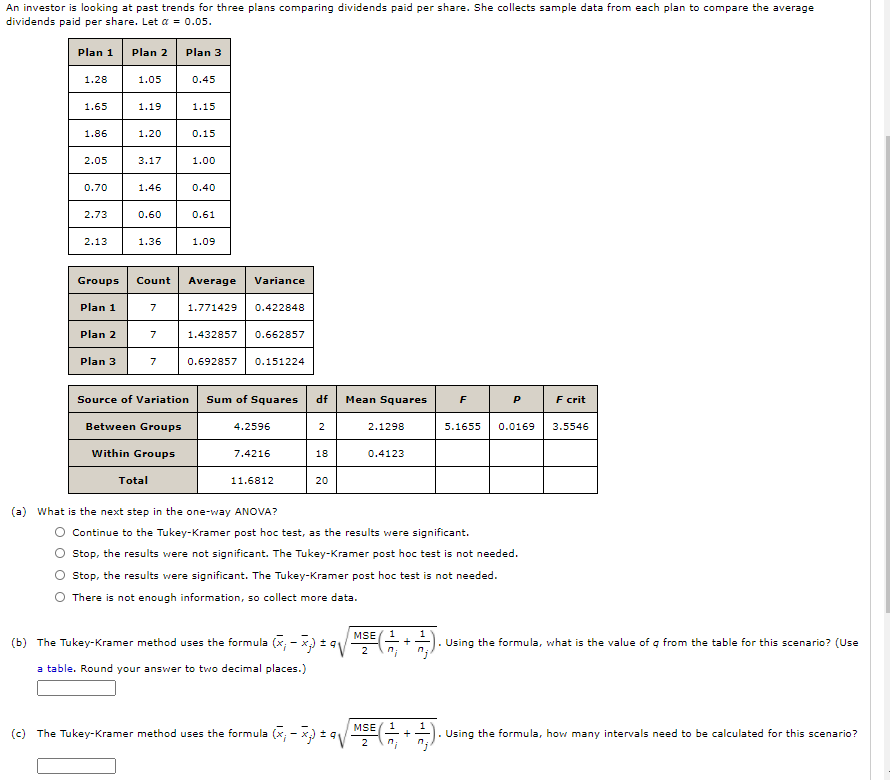
An investor is looking at past trends för three plans comparing dividends paid per share. She collects sample data from each plan to compare the average dividends paid per share. Let a = 0.05. Plan 1 Plan 2 Plan 3 1.28 1.05 0.45 1.65 1.19 1.15 1.86 1.20 0.15 2.05 3.17 1.00 0.70 1.46 0.40 2.73 0.60 0.61 2.13 1.36 1.09 Groups Count Average Variance Plan 1 7 1.771429 0.422848 Plan 2 7 1.432857 0.662857 Plan 3 7 0.692857 0.151224 Sum of Squares df Mean Squares F crit Source of Variation F Between Groups 4.2596 2 2.1298 5.1655 0.0169 3.5546 Within Groups 7.4216 18 0.4123 Total 11.6812 20 (a) What is the next step in the one-way ANOVA? Continue to the Tukey-Kramer post hoc test, as the results were significant. Stop, the results were not significant. The Tukey-Kramer post hoc test is not needed. Stop, the results were significant. The Tukey-Kramer post hoc test is not needed. There is not enough information, so collect more data. MSE 1 1 (b) The Tukey-Kramer method uses the formula (x; - x) V Using the formula, what is the value of g from the table for this scenario? (Use a table. Round your answer to two decimal places.) MSE (c) The Tukey-Kramer method uses the formula (x, - x) + 9 2 + Using the formula, how many intervals need to be calculated for this scenario?
An investor is looking at past trends för three plans comparing dividends paid per share. She collects sample data from each plan to compare the average dividends paid per share. Let a = 0.05. Plan 1 Plan 2 Plan 3 1.28 1.05 0.45 1.65 1.19 1.15 1.86 1.20 0.15 2.05 3.17 1.00 0.70 1.46 0.40 2.73 0.60 0.61 2.13 1.36 1.09 Groups Count Average Variance Plan 1 7 1.771429 0.422848 Plan 2 7 1.432857 0.662857 Plan 3 7 0.692857 0.151224 Sum of Squares df Mean Squares F crit Source of Variation F Between Groups 4.2596 2 2.1298 5.1655 0.0169 3.5546 Within Groups 7.4216 18 0.4123 Total 11.6812 20 (a) What is the next step in the one-way ANOVA? Continue to the Tukey-Kramer post hoc test, as the results were significant. Stop, the results were not significant. The Tukey-Kramer post hoc test is not needed. Stop, the results were significant. The Tukey-Kramer post hoc test is not needed. There is not enough information, so collect more data. MSE 1 1 (b) The Tukey-Kramer method uses the formula (x; - x) V Using the formula, what is the value of g from the table for this scenario? (Use a table. Round your answer to two decimal places.) MSE (c) The Tukey-Kramer method uses the formula (x, - x) + 9 2 + Using the formula, how many intervals need to be calculated for this scenario?

MATLAB: An Introduction with Applications
6th Edition
ISBN:9781119256830
Author:Amos Gilat
Publisher:Amos Gilat
Chapter1: Starting With Matlab
Section: Chapter Questions
Problem 1P

Related questions
Question
Transcribed Image Text:An investor is looking at past trends for three plans comparing dividends paid per share. She collects sample data from each plan to compare the average
dividends paid per share. Let a = 0.05.
Plan 1 Plan 2
Plan 3
1.28
1.05
0.45
1.65
1.19
1.15
1.86
1.20
0.15
2.05
3.17
1.00
0.70
1.46
0.40
2.73
0.60
0.61
2.13
1.36
1.09
Groups
Count
Average
Variance
Plan 1
7
1.771429
0.422848
Plan 2
7
1.432857
0.662857
Plan 3
7
0.692857
0.151224
Source of Variation
Sum of Squares
df
Mean Squares
P
F crit
Between Groups
4.2596
2
2.1298
5.1655
0.0169
3.5546
Within Groups
7.4216
18
0.4123
Total
11.6812
20
(a) What is the next step in the one-way ANOVA?
Continue to the Tukey-Kramer post hoc test, as the results were significant.
Stop, the results were not significant. The Tukey-Kramer post hoc test is not needed.
Stop, the results were significant. The Tukey-Kramer post hoc test is not needed.
There is not enough information, so collect more data.
1
+
MSE
(b) The Tukey-Kramer method uses the formula (x; - x) +
Using the formula, what is the value of g from the table for this scenario? (Use
a table. Round your answer to two decimal places.)
1
1
+
MSE
(c) The Tukey-Kramer method uses the formula (x; - x) + 9
2
Using the formula, how many intervals need to be calculated for this scenario?
Expert Solution
This question has been solved!
Explore an expertly crafted, step-by-step solution for a thorough understanding of key concepts.

This is a popular solution!

Trending now
This is a popular solution!

Step by step
Solved in 3 steps with 1 images

Knowledge Booster


Learn more about
Need a deep-dive on the concept behind this application? Look no further. Learn more about this topic, statistics and related others by exploring similar questions and additional content below.Recommended textbooks for you
MATLAB: An Introduction with Applications
Statistics
ISBN:
9781119256830
Author:
Amos Gilat
Publisher:
John Wiley & Sons Inc

Probability and Statistics for Engineering and th…
Statistics
ISBN:
9781305251809
Author:
Jay L. Devore
Publisher:
Cengage Learning

Statistics for The Behavioral Sciences (MindTap C…
Statistics
ISBN:
9781305504912
Author:
Frederick J Gravetter, Larry B. Wallnau
Publisher:
Cengage Learning
MATLAB: An Introduction with Applications
Statistics
ISBN:
9781119256830
Author:
Amos Gilat
Publisher:
John Wiley & Sons Inc
Probability and Statistics for Engineering and th…
Statistics
ISBN:
9781305251809
Author:
Jay L. Devore
Publisher:
Cengage Learning
Statistics for The Behavioral Sciences (MindTap C…
Statistics
ISBN:
9781305504912
Author:
Frederick J Gravetter, Larry B. Wallnau
Publisher:
Cengage Learning

Elementary Statistics: Picturing the World (7th E…
Statistics
ISBN:
9780134683416
Author:
Ron Larson, Betsy Farber
Publisher:
PEARSON

The Basic Practice of Statistics
Statistics
ISBN:
9781319042578
Author:
David S. Moore, William I. Notz, Michael A. Fligner
Publisher:
W. H. Freeman

Introduction to the Practice of Statistics
Statistics
ISBN:
9781319013387
Author:
David S. Moore, George P. McCabe, Bruce A. Craig
Publisher:
W. H. Freeman