Reading interventions - Jasmine is a reading curriculum specialist for a large urban school district. She regularly conducts pilot studies of promising educational programs to determine if they should be implemented throughout the district. During fall term last year, she randomly selected a group of 24 eighth graders at a large middle school to participate in a supplemental tutoring program. Call this group the "Fall Cohort." At the end of the term the Fall Cohort students were evaluated using a standardized test. The sample mean score for the 24 students was 67.88 points with a standard deviation of 14.86 points. Historically, scores for students in the district on this assessment have been normally distributed with mean of 62.7 points. Jasmine wants to use statistical inference to determine if mean scores on this exam for students in the Fall Cohort are higher than the historical mean. Round all calculated values to 4 decimal places. 1. Which set of hypotheses statements below should Jasmine use to answer her research question? OA. Ho: = 62.7 vs. HA: > 67.88 OB. Ho: µ = 62.7 vs. HA: µ > 62.7 OC. Ho: H = 62.7 vs. HA: > 67.88 OD. Ho: H = 62.7 vs. HA: H + 62.7 2. Which of the following conditions must be met to perform this hypothesis test? Select all the correct answers. MA. The scores for students in the Fall Cohort must be normally distributed. VB. The scores for all students in the district must be normally distributed. MC. We must be able to expect that at least 5 students will have scores above the historical mean. OD. The sample must be large enough so that at least 10 students fail and 10 succeed. DE. The observations must be independent. 3. Calculate the test statistic for Jasmine's hypothesis test. 1.7077 4. Jasmine calculated a p-value of 0.0506. Which of the following is a correct interpretation of the p-value? OA. There is a 5.0577% chance that the true mean is u = 62.7. OB. The p-value is the probability of obtaining a sample result equal to or greater than 67.88 under the null model where Ho = 62.7. OC. The p-value is the proportion of times in repeated sampling under the null model that the true mean will be more than 67.88. OD. In repeated sampling, we expect the sample mean to be within 0.0506 of the true mean, on average.
Reading interventions - Jasmine is a reading curriculum specialist for a large urban school district. She regularly conducts pilot studies of promising educational programs to determine if they should be implemented throughout the district. During fall term last year, she randomly selected a group of 24 eighth graders at a large middle school to participate in a supplemental tutoring program. Call this group the "Fall Cohort." At the end of the term the Fall Cohort students were evaluated using a standardized test. The sample mean score for the 24 students was 67.88 points with a standard deviation of 14.86 points. Historically, scores for students in the district on this assessment have been normally distributed with mean of 62.7 points. Jasmine wants to use statistical inference to determine if mean scores on this exam for students in the Fall Cohort are higher than the historical mean. Round all calculated values to 4 decimal places. 1. Which set of hypotheses statements below should Jasmine use to answer her research question? OA. Ho: = 62.7 vs. HA: > 67.88 OB. Ho: µ = 62.7 vs. HA: µ > 62.7 OC. Ho: H = 62.7 vs. HA: > 67.88 OD. Ho: H = 62.7 vs. HA: H + 62.7 2. Which of the following conditions must be met to perform this hypothesis test? Select all the correct answers. MA. The scores for students in the Fall Cohort must be normally distributed. VB. The scores for all students in the district must be normally distributed. MC. We must be able to expect that at least 5 students will have scores above the historical mean. OD. The sample must be large enough so that at least 10 students fail and 10 succeed. DE. The observations must be independent. 3. Calculate the test statistic for Jasmine's hypothesis test. 1.7077 4. Jasmine calculated a p-value of 0.0506. Which of the following is a correct interpretation of the p-value? OA. There is a 5.0577% chance that the true mean is u = 62.7. OB. The p-value is the probability of obtaining a sample result equal to or greater than 67.88 under the null model where Ho = 62.7. OC. The p-value is the proportion of times in repeated sampling under the null model that the true mean will be more than 67.88. OD. In repeated sampling, we expect the sample mean to be within 0.0506 of the true mean, on average.

Chapter9: Sequences, Probability And Counting Theory
Section9.7: Probability
Problem 4SE: What is the difference between events and outcomes? Give an example of both using the sample space...

Related questions

Question
I need help with question 1, 2 and 4 plz.
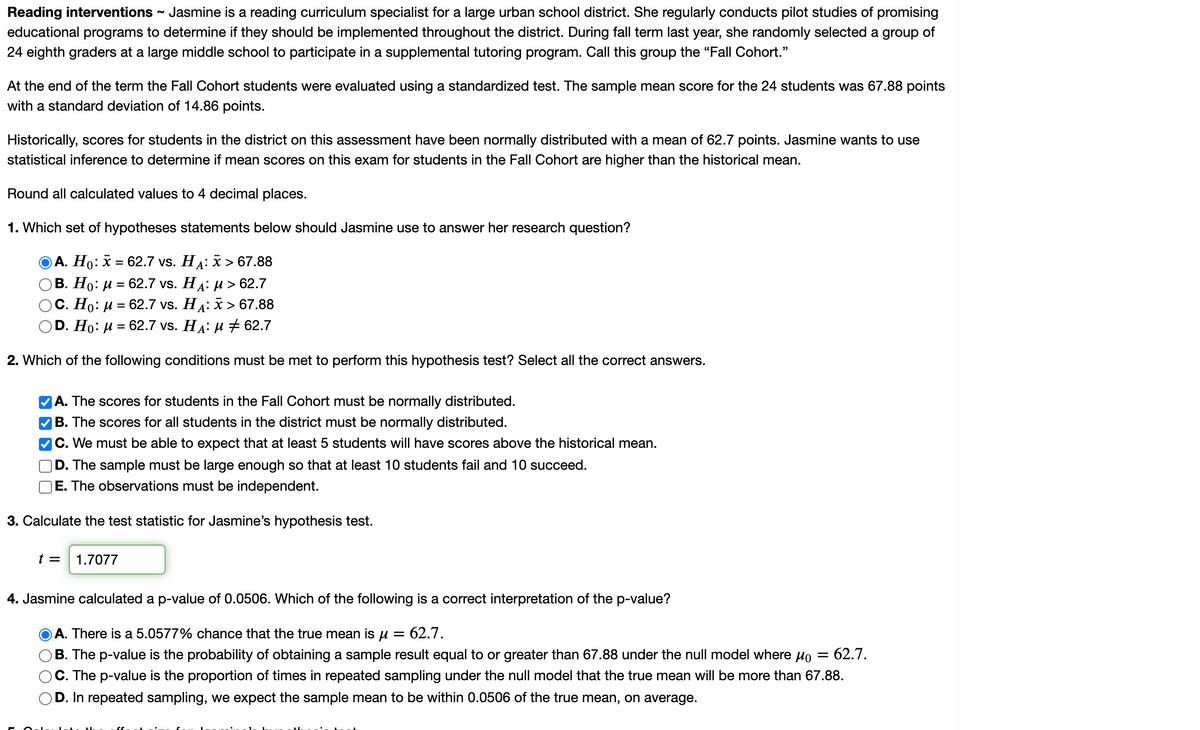
Transcribed Image Text:Reading interventions - Jasmine is a reading curriculum specialist for a large urban school district. She regularly conducts pilot studies of promising
educational programs to determine if they should be implemented throughout the district. During fall term last year, she randomly selected a group of
24 eighth graders at a large middle school to participate in a supplemental tutoring program. Call this group the "Fall Cohort."
At the end of the term the Fall Cohort students were evaluated using a standardized test. The sample mean score for the 24 students was 67.88 points
with a standard deviation of 14.86 points.
Historically, scores for students in the district on this assessment have been normally distributed with a mean of 62.7 points. Jasmine wants to use
statistical inference to determine if mean scores on this exam for students in the Fall Cohort are higher than the historical mean.
Round all calculated values to 4 decimal places.
1. Which set of hypotheses statements below should Jasmine use to answer her research question?
А. Но:
— 62.7 vs. HА:X > 67.88
В. Но: и %3D 62.7 vs. Ha: и > 62.7
С. Но: и 3 62.7 vs. Ha: х> 67.88
D. Ho: и %3D 62.7 vs. Ha: и # 62.7
2. Which of the following conditions must be met to perform this hypothesis test? Select all the correct answers.
A. The scores for students in the Fall Cohort must be normally distributed.
VB. The scores for all students in the district must be normally distributed.
C. We must be able to expect that at least 5 students will have scores above the historical mean.
D. The sample must be large enough so that at least 10 students fail and 10 succeed.
E. The observations must be independent.
3. Calculate the test statistic for Jasmine's hypothesis test.
t =
1.7077
4. Jasmine calculated a p-value of 0.0506. Which of the following is a correct interpretation of the p-value?
A. There is a 5.0577% chance that the true mean is u =
= 62.7.
B. The p-value is the probability of obtaining a sample result equal to or greater than 67.88 under the null model where Ho
62.7.
C. The p-value is the proportion of times in repeated sampling under the null model that the true mean will be more than 67.88.
D. In repeated sampling, we expect the sample mean to be within 0.0506 of the true mean, on average.
Expert Solution
This question has been solved!
Explore an expertly crafted, step-by-step solution for a thorough understanding of key concepts.

This is a popular solution!

Trending now
This is a popular solution!

Step by step
Solved in 2 steps

Knowledge Booster


Learn more about
Need a deep-dive on the concept behind this application? Look no further. Learn more about this topic, statistics and related others by exploring similar questions and additional content below.Recommended textbooks for you

College Algebra (MindTap Course List)
Algebra
ISBN:
9781305652231
Author:
R. David Gustafson, Jeff Hughes
Publisher:
Cengage Learning

Holt Mcdougal Larson Pre-algebra: Student Edition…
Algebra
ISBN:
9780547587776
Author:
HOLT MCDOUGAL
Publisher:
HOLT MCDOUGAL
College Algebra (MindTap Course List)
Algebra
ISBN:
9781305652231
Author:
R. David Gustafson, Jeff Hughes
Publisher:
Cengage Learning
Holt Mcdougal Larson Pre-algebra: Student Edition…
Algebra
ISBN:
9780547587776
Author:
HOLT MCDOUGAL
Publisher:
HOLT MCDOUGAL