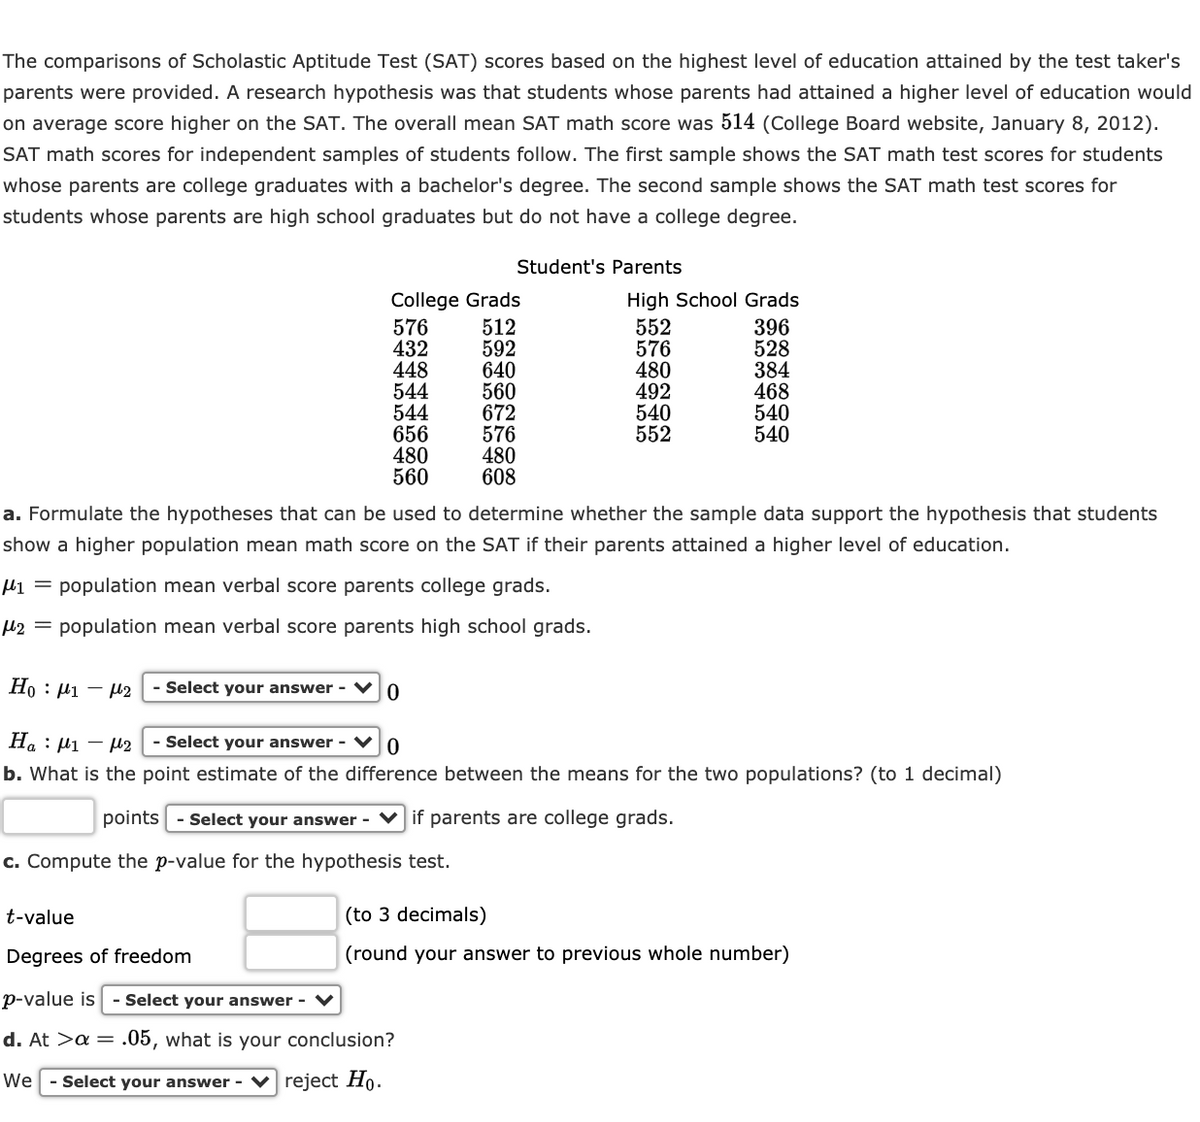
The comparisons of Scholastic Aptitude Test (SAT) scores based on the highest level of education attained by the test taker's parents were provided. A research hypothesis was that students whose parents had attained a higher level of education would on average score higher on the SAT. The overall mean SAT math score was 514 (College Board website, January 8, 2012). SAT math scores for independent samples of students follow. The first sample shows the SAT math test scores for students whose parents are college graduates with a bachelor's degree. The second sample shows the SAT math test scores for students whose parents are high school graduates but do not have a college degree. Student's Parents College Grads 576 512 432 592 448 640 544 560 544 672 576 656 480 480 560 608 High School Grads 552 576 480 492 540 552 396 528 384 468 540 540 a. Formulate the hypotheses that can be used to determine whether the sample data support the hypothesis that students show a higher population mean math score on the SAT if their parents attained a higher level of education. µi = population mean verbal score parents college grads. µ2 = population mean verbal score parents high school grads. Họ : µ1 – µ2 - Select your answer - Ha : µ1 – µ2 - Select your answer - b. What is the point estimate of the difference between the means for the two populations? (to 1 decimal) points - Select your answer - Vif parents are college grads. c. Compute the p-value for the hypothesis test. t-value (to 3 decimals) Degrees of freedom (round your answer to previous whole number) p-value is - Select your answer - ♥ d. At >a = .05, what is your conclusion? We - Select your answer - reject Ho.


Inverse Normal Distribution
The method used for finding the corresponding z-critical value in a normal distribution using the known probability is said to be an inverse normal distribution. The inverse normal distribution is a continuous probability distribution with a family of two parameters.
Mean, Median, Mode
It is a descriptive summary of a data set. It can be defined by using some of the measures. The central tendencies do not provide information regarding individual data from the dataset. However, they give a summary of the data set. The central tendency or measure of central tendency is a central or typical value for a probability distribution.
Z-Scores
A z-score is a unit of measurement used in statistics to describe the position of a raw score in terms of its distance from the mean, measured with reference to standard deviation from the mean. Z-scores are useful in statistics because they allow comparison between two scores that belong to different normal distributions.


Trending now
This is a popular solution!

Step by step
Solved in 4 steps


