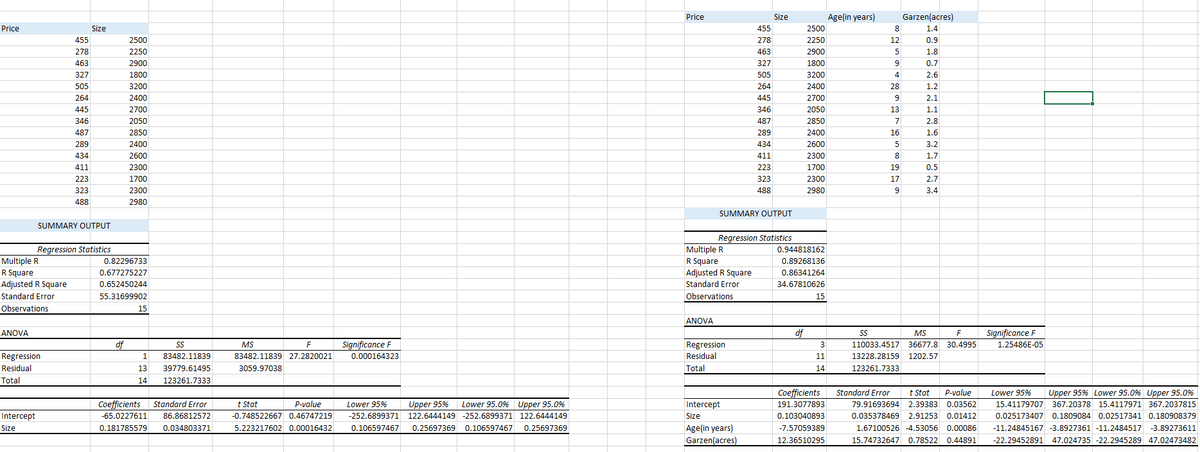
real estate agent wanted to find the relationship between sale price of houses and the size of the house. Shecollected data on two variables recorded in the following table for 15 houses in Seattle. The two variables are PRICE= Sale price of houses in thousands of dollars SIZE= Area of the entire house in square feet. The Excel working has been given. Note: the left hand side is Regression run(ans a).. The right hand side is 'new' regression run (for ans d). Question b) Interpret the slope and constant term with proper UNITS assigned. c) Comment on the explanatory power of the regression model from the required output. Copy that specific output into your assignment word document. Now to increase the explanatory power of the model the real estate agent decides to look at the age of the house and the garden size. For the 15 houses in our sample the new variables are AGE= Age of the house in years, since it was built GARDEN= Area of the garden in acres. d) Once these two new variables are added- run the new regression using MICROSOFT EXCEL. Copy the output into your assignment word document from which you can write down the new least square regression line. Write down the new least square regression line from that specific output. (The excel work has been given above, please answer the rest, if any) e) Interpret the coefficients with all the independent variables with proper UNITS


Correlation
Correlation defines a relationship between two independent variables. It tells the degree to which variables move in relation to each other. When two sets of data are related to each other, there is a correlation between them.
Linear Correlation
A correlation is used to determine the relationships between numerical and categorical variables. In other words, it is an indicator of how things are connected to one another. The correlation analysis is the study of how variables are related.
Regression Analysis
Regression analysis is a statistical method in which it estimates the relationship between a dependent variable and one or more independent variable. In simple terms dependent variable is called as outcome variable and independent variable is called as predictors. Regression analysis is one of the methods to find the trends in data. The independent variable used in Regression analysis is named Predictor variable. It offers data of an associated dependent variable regarding a particular outcome.
A real estate agent wanted to find the relationship between sale price of houses and the size of the house. Shecollected data on two variables recorded in the following table for 15 houses in Seattle. The two variables are
PRICE= Sale price of houses in thousands of dollars
SIZE= Area of the entire house in square feet.
The Excel working has been given.
Note: the left hand side is Regression run(ans a).. The right hand side is 'new' regression run (for ans d).
Question
b) Interpret the slope and constant term with proper UNITS assigned.
c) Comment on the explanatory power of the regression model from the required output. Copy that specific
output into your assignment word document.
Now to increase the explanatory power of the model the real estate agent decides to look at the age of the
house and the garden size. For the 15 houses in our sample the new variables are
AGE= Age of the house in years, since it was built
GARDEN= Area of the garden in acres.
d) Once these two new variables are added- run the new regression using MICROSOFT EXCEL. Copy the output
into your assignment word document from which you can write down the new least square regression line. Write down the new least square regression line from that specific output. (The excel work has been given above, please answer the rest, if any)
e) Interpret the coefficients with all the independent variables with proper UNITS.

Step by step
Solved in 2 steps with 1 images


