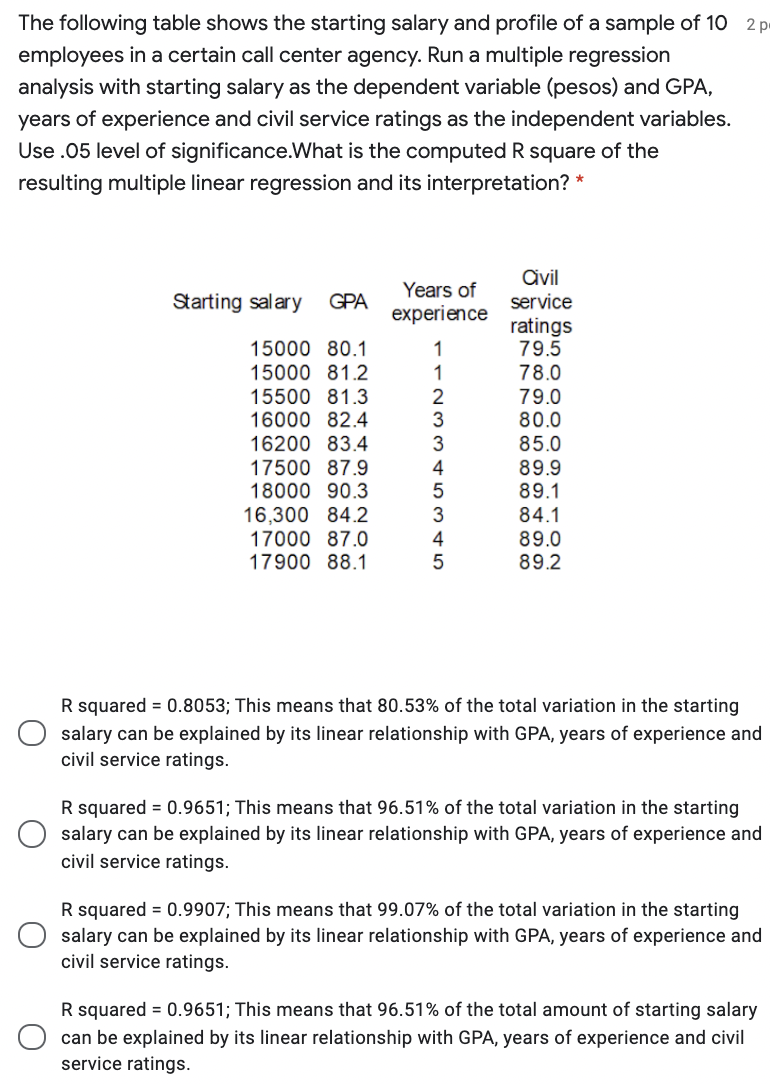
The following table shows the starting salary and profile of a sample of 10 employees in a certain call center agency. Run a multiple regression analysis with starting salary as the dependent variable (pesos) and GPA, years of experience and civil service ratings as the independent variables. Use .05 level of significance.What is the computed R square of the resulting multiple linear regression and its interpretation? *
The following table shows the starting salary and profile of a sample of 10 employees in a certain call center agency. Run a multiple regression analysis with starting salary as the dependent variable (pesos) and GPA, years of experience and civil service ratings as the independent variables. Use .05 level of significance.What is the computed R square of the resulting multiple linear regression and its interpretation? *

MATLAB: An Introduction with Applications
6th Edition
ISBN:9781119256830
Author:Amos Gilat
Publisher:Amos Gilat
Chapter1: Starting With Matlab
Section: Chapter Questions
Problem 1P

Related questions
Question
Transcribed Image Text:The following table shows the starting salary and profile of a sample of 10 2 p
employees in a certain call center agency. Run a multiple regression
analysis with starting salary as the dependent variable (pesos) and GPA,
years of experience and civil service ratings as the independent variables.
Use .05 level of significance.What is the computed R square of the
resulting multiple linear regression and its interpretation? *
Civil
Years of
Starting salary
GPA
service
experience
ratings
79.5
15000 80.1
15000 81.2
78.0
15500 81.3
79.0
16000 82.4
80.0
16200 83.4
85.0
17500 87.9
89.9
89.1
18000 90.3
16,300 84.2
17000 87.0
17900 88.1
84.1
89.0
89.2
R squared = 0.8053; This means that 80.53% of the total variation in the starting
salary can be explained by its linear relationship with GPA, years of experience and
civil service ratings.
R squared = 0.9651; This means that 96.51% of the total variation in the starting
salary can be explained by its linear relationship with GPA, years of experience and
civil service ratings.
R squared = 0.9907; This means that 99.07% of the total variation in the starting
salary can be explained by its linear relationship with GPA, years of experience and
civil service ratings.
R squared = 0.9651; This means that 96.51% of the total amount of starting salary
can be explained by its linear relationship with GPA, years of experience and civil
service ratings.
1123 345 45
Expert Solution
This question has been solved!
Explore an expertly crafted, step-by-step solution for a thorough understanding of key concepts.

This is a popular solution!

Trending now
This is a popular solution!

Step by step
Solved in 3 steps with 2 images

Recommended textbooks for you
MATLAB: An Introduction with Applications
Statistics
ISBN:
9781119256830
Author:
Amos Gilat
Publisher:
John Wiley & Sons Inc

Probability and Statistics for Engineering and th…
Statistics
ISBN:
9781305251809
Author:
Jay L. Devore
Publisher:
Cengage Learning

Statistics for The Behavioral Sciences (MindTap C…
Statistics
ISBN:
9781305504912
Author:
Frederick J Gravetter, Larry B. Wallnau
Publisher:
Cengage Learning
MATLAB: An Introduction with Applications
Statistics
ISBN:
9781119256830
Author:
Amos Gilat
Publisher:
John Wiley & Sons Inc
Probability and Statistics for Engineering and th…
Statistics
ISBN:
9781305251809
Author:
Jay L. Devore
Publisher:
Cengage Learning
Statistics for The Behavioral Sciences (MindTap C…
Statistics
ISBN:
9781305504912
Author:
Frederick J Gravetter, Larry B. Wallnau
Publisher:
Cengage Learning

Elementary Statistics: Picturing the World (7th E…
Statistics
ISBN:
9780134683416
Author:
Ron Larson, Betsy Farber
Publisher:
PEARSON

The Basic Practice of Statistics
Statistics
ISBN:
9781319042578
Author:
David S. Moore, William I. Notz, Michael A. Fligner
Publisher:
W. H. Freeman

Introduction to the Practice of Statistics
Statistics
ISBN:
9781319013387
Author:
David S. Moore, George P. McCabe, Bruce A. Craig
Publisher:
W. H. Freeman