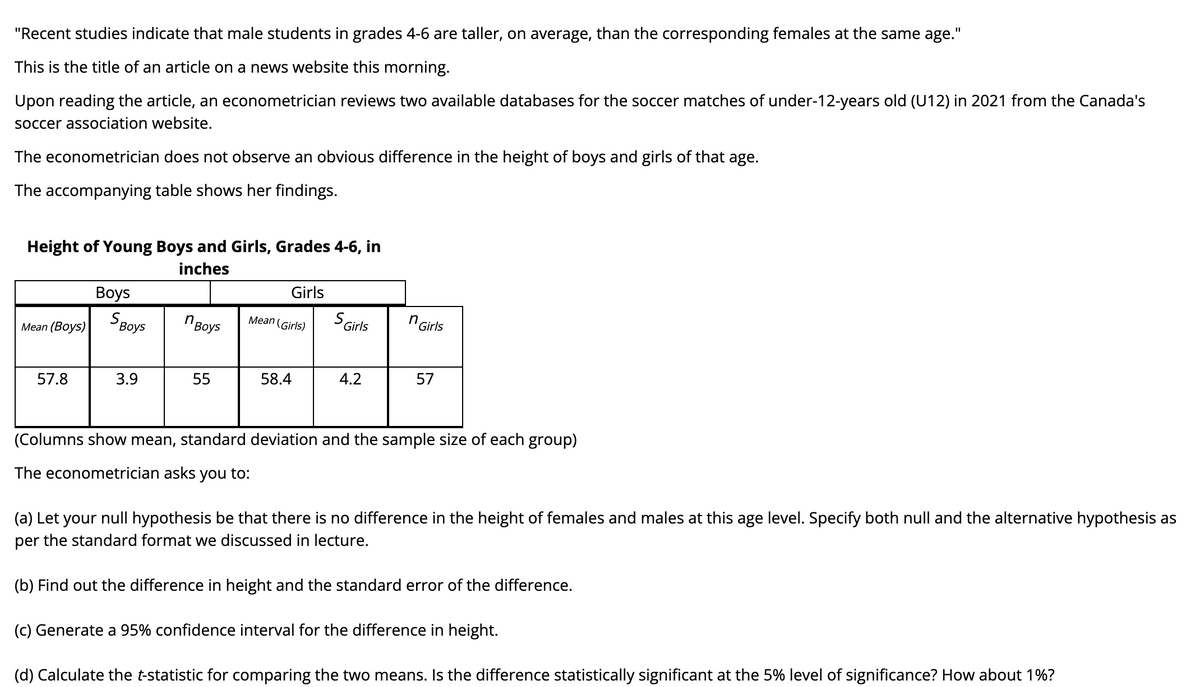
"Recent studies indicate that male students in grades 4-6 are taller, on average, than the corresponding females at the same age." This is the title of an article on a news website this morning. Upon reading the article, an econometrician reviews two available databases for the soccer matches of under-12-years old (U12) in 2021 from the Canada's soccer association website. The econometrician does not observe an obvious difference in the height of boys and girls of that age. The accompanying table shows her findings. Height of Young Boys and Girls, Grades 4-6, in inches Girls Boys S Boys "Boys S Girls n Girls Mean (Girls) Mean (Boys) 57.8 3.9 55 58.4 4.2 57 (Columns show mean, standard deviation and the sample size of each group) The econometrician asks you to: (a) Let your null hypothesis be that there is no difference in the height of females and males at this age level. Specify both null and the alternative hypothesis as per the standard format we discussed in lecture. (b) Find out the difference in height and the standard error of the difference. (c) Generate a 95% confidence interval for the difference in height. (d) Calculate the t-statistic for comparing the two means. Is the difference statistically significant at the 5% level of significance? How about 1%?
"Recent studies indicate that male students in grades 4-6 are taller, on average, than the corresponding females at the same age." This is the title of an article on a news website this morning. Upon reading the article, an econometrician reviews two available databases for the soccer matches of under-12-years old (U12) in 2021 from the Canada's soccer association website. The econometrician does not observe an obvious difference in the height of boys and girls of that age. The accompanying table shows her findings. Height of Young Boys and Girls, Grades 4-6, in inches Girls Boys S Boys "Boys S Girls n Girls Mean (Girls) Mean (Boys) 57.8 3.9 55 58.4 4.2 57 (Columns show mean, standard deviation and the sample size of each group) The econometrician asks you to: (a) Let your null hypothesis be that there is no difference in the height of females and males at this age level. Specify both null and the alternative hypothesis as per the standard format we discussed in lecture. (b) Find out the difference in height and the standard error of the difference. (c) Generate a 95% confidence interval for the difference in height. (d) Calculate the t-statistic for comparing the two means. Is the difference statistically significant at the 5% level of significance? How about 1%?

MATLAB: An Introduction with Applications
6th Edition
ISBN:9781119256830
Author:Amos Gilat
Publisher:Amos Gilat
Chapter1: Starting With Matlab
Section: Chapter Questions
Problem 1P

Related questions
Question
7)
Transcribed Image Text:"Recent studies indicate that male students in grades 4-6 are taller, on average, than the corresponding females at the same age."
This is the title of an article on a news website this morning.
Upon reading the article, an econometrician reviews two available databases for the soccer matches of under-12-years old (U12) in 2021 from the Canada's
soccer association website.
The econometrician does not observe an obvious difference in the height of boys and girls of that age.
The accompanying table shows her findings.
Height of Young Boys and Girls, Grades 4-6, in
inches
Girls
Вoys
S Girls
n Girls
Мean (Boys)| воys
" Boys
Mean (Girls)
57.8
3.9
55
58.4
4.2
57
(Columns show mean, standard deviation and the sample size of each group)
The econometrician asks you to:
(a) Let your null hypothesis be that there is no difference in the height of females and males at this age level. Specify both null and the alternative hypothesis as
per the standard format we discussed in lecture.
(b) Find out the difference in height and the standard error of the difference.
(c) Generate a 95% confidence interval for the difference in height.
(d) Calculate the t-statistic for comparing the two means. Is the difference statistically significant at the 5% level of significance? How about 1%?
Expert Solution
This question has been solved!
Explore an expertly crafted, step-by-step solution for a thorough understanding of key concepts.

Step by step
Solved in 6 steps with 5 images

Recommended textbooks for you
MATLAB: An Introduction with Applications
Statistics
ISBN:
9781119256830
Author:
Amos Gilat
Publisher:
John Wiley & Sons Inc

Probability and Statistics for Engineering and th…
Statistics
ISBN:
9781305251809
Author:
Jay L. Devore
Publisher:
Cengage Learning

Statistics for The Behavioral Sciences (MindTap C…
Statistics
ISBN:
9781305504912
Author:
Frederick J Gravetter, Larry B. Wallnau
Publisher:
Cengage Learning
MATLAB: An Introduction with Applications
Statistics
ISBN:
9781119256830
Author:
Amos Gilat
Publisher:
John Wiley & Sons Inc
Probability and Statistics for Engineering and th…
Statistics
ISBN:
9781305251809
Author:
Jay L. Devore
Publisher:
Cengage Learning
Statistics for The Behavioral Sciences (MindTap C…
Statistics
ISBN:
9781305504912
Author:
Frederick J Gravetter, Larry B. Wallnau
Publisher:
Cengage Learning

Elementary Statistics: Picturing the World (7th E…
Statistics
ISBN:
9780134683416
Author:
Ron Larson, Betsy Farber
Publisher:
PEARSON

The Basic Practice of Statistics
Statistics
ISBN:
9781319042578
Author:
David S. Moore, William I. Notz, Michael A. Fligner
Publisher:
W. H. Freeman

Introduction to the Practice of Statistics
Statistics
ISBN:
9781319013387
Author:
David S. Moore, George P. McCabe, Bruce A. Craig
Publisher:
W. H. Freeman