Refer to Table S6.1 - Factors for Computing Control Chart Limits (3 sigma) for this problem. Thirty-five samples of size 7 each were taken from a fertilizer-bag-filling machine at Panos Kouvelis Lifelong Lawn Ltd. The results were: Overall mean = 60.75 lb.; Average range R = 1.64 lb. a) For the given sample size, the control limits for 3-sigma x chart are: Upper Control Limit (UCL-) = 61.437 lb. (round your response to three decimal places). Lower Control Limit (LCL;) = Ib. (round your response to three decimal places).
Refer to Table S6.1 - Factors for Computing Control Chart Limits (3 sigma) for this problem. Thirty-five samples of size 7 each were taken from a fertilizer-bag-filling machine at Panos Kouvelis Lifelong Lawn Ltd. The results were: Overall mean = 60.75 lb.; Average range R = 1.64 lb. a) For the given sample size, the control limits for 3-sigma x chart are: Upper Control Limit (UCL-) = 61.437 lb. (round your response to three decimal places). Lower Control Limit (LCL;) = Ib. (round your response to three decimal places).

Practical Management Science
6th Edition
ISBN:9781337406659
Author:WINSTON, Wayne L.
Publisher:WINSTON, Wayne L.
Chapter10: Introduction To Simulation Modeling
Section10.2: Probability Distributions For Input Variables
Problem 2P: Use Excels functions (not @RISK) to generate 1000 random numbers from a normal distribution with...

Related questions
Question
100%
hw3q2
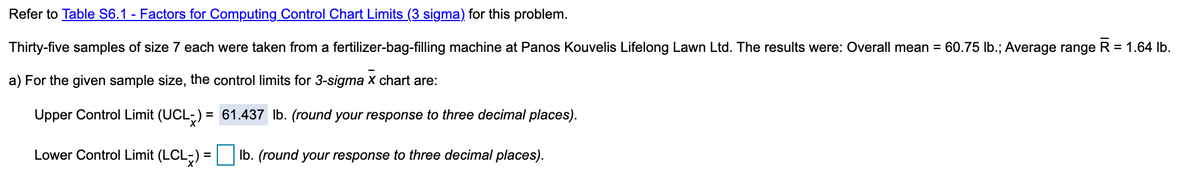
Transcribed Image Text:Refer to Table S6.1 - Factors for Computing Control Chart Limits (3 sigma) for this problem.
Thirty-five samples of size 7 each were taken from a fertilizer-bag-filling machine at Panos Kouvelis Lifelong Lawn Ltd. The results were: Overall mean = 60.75 lb.; Average range R = 1.64 lb.
a) For the given sample size, the control limits for 3-sigma x chart are:
Upper Control Limit (UCL-) = 61.437 Ib. (round your response to three decimal places).
Lower Control Limit (LCL;) = Ib. (round your response to three decimal places).
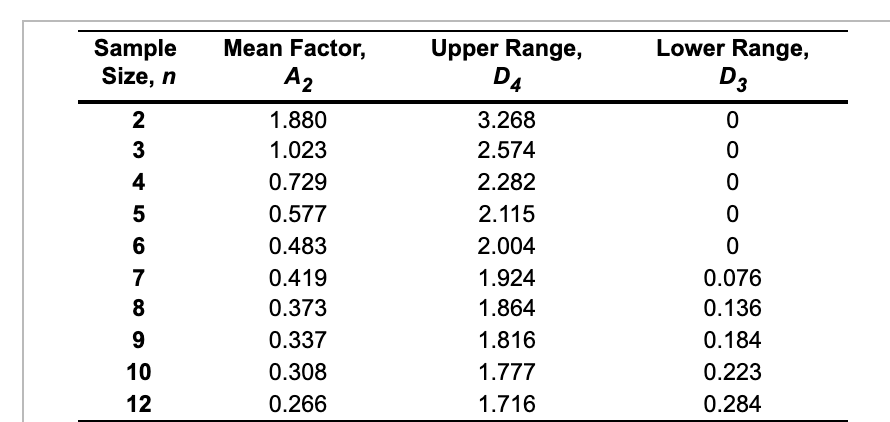
Transcribed Image Text:Mean Factor,
Sample
Size, n
Upper Range,
D4
Lower Range,
D3
A2
1.880
3.268
3
1.023
2.574
4
0.729
2.282
0.577
2.115
6
0.483
2.004
7
0.419
1.924
0.076
0.373
1.864
0.136
9
0.337
1.816
0.184
10
0.308
1.777
0.223
12
0.266
1.716
0.284
Expert Solution
This question has been solved!
Explore an expertly crafted, step-by-step solution for a thorough understanding of key concepts.

This is a popular solution!

Trending now
This is a popular solution!

Step by step
Solved in 2 steps with 2 images

Recommended textbooks for you
Practical Management Science
Operations Management
ISBN:
9781337406659
Author:
WINSTON, Wayne L.
Publisher:
Cengage,
Practical Management Science
Operations Management
ISBN:
9781337406659
Author:
WINSTON, Wayne L.
Publisher:
Cengage,