Refer to the accompanying data display that results from a sample of airport data speeds in Mbps. Complete parts (a) through (c) below. Tinterval E Click the icon to view a t distribution table. (13.046,22.15) x= 17.598 Sx = 16.01712719 n= 50 a. What is the number of degrees of freedom that should be used for finding the critical value t,12? df = O (Type a whole number. b. Find the critical value t/2 corresponding to a 95% confidence level. (Round to two decimal places as needed.) c. Give a brief general description of the number of degrees of freedom. O A. The number of degrees of freedom for a collection of sample data is the number of unique, non-repeated sample values. O B. The number of degrees of freedom for a collection of sample data is the total number of sample values. OC. The number of degrees of freedom for a collection of sample data is the number of sample values that are determined after certain restrictions have been imposed on all data values. O D. The number of degrees of freedom for a collection of sample data is the number of sample values that can vary after certain restrictions have been imposed on all data values.
Refer to the accompanying data display that results from a sample of airport data speeds in Mbps. Complete parts (a) through (c) below. Tinterval E Click the icon to view a t distribution table. (13.046,22.15) x= 17.598 Sx = 16.01712719 n= 50 a. What is the number of degrees of freedom that should be used for finding the critical value t,12? df = O (Type a whole number. b. Find the critical value t/2 corresponding to a 95% confidence level. (Round to two decimal places as needed.) c. Give a brief general description of the number of degrees of freedom. O A. The number of degrees of freedom for a collection of sample data is the number of unique, non-repeated sample values. O B. The number of degrees of freedom for a collection of sample data is the total number of sample values. OC. The number of degrees of freedom for a collection of sample data is the number of sample values that are determined after certain restrictions have been imposed on all data values. O D. The number of degrees of freedom for a collection of sample data is the number of sample values that can vary after certain restrictions have been imposed on all data values.

Glencoe Algebra 1, Student Edition, 9780079039897, 0079039898, 2018
18th Edition
ISBN:9780079039897
Author:Carter
Publisher:Carter
Chapter10: Statistics
Section10.1: Measures Of Center
Problem 9PPS

Related questions

Concept explainers
Contingency Table
A contingency table can be defined as the visual representation of the relationship between two or more categorical variables that can be evaluated and registered. It is a categorical version of the scatterplot, which is used to investigate the linear relationship between two variables. A contingency table is indeed a type of frequency distribution table that displays two variables at the same time.
Binomial Distribution
Binomial is an algebraic expression of the sum or the difference of two terms. Before knowing about binomial distribution, we must know about the binomial theorem.
Topic Video
Question
24
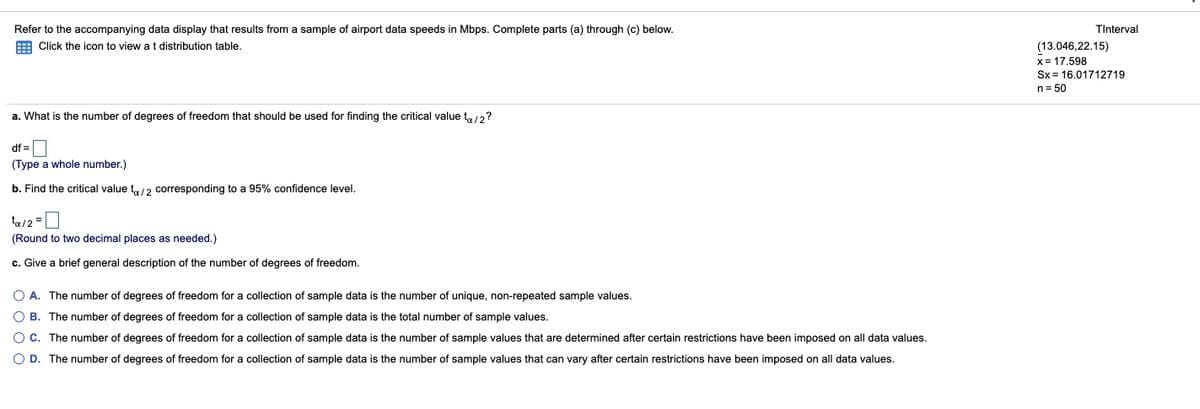
Transcribed Image Text:Refer to the accompanying data display that results from a sample of airport data speeds in Mbps. Complete parts (a) through (c) below.
TInterval
E Click the icon to view at distribution table.
(13.046,22.15)
x= 17.598
Sx = 16.01712719
n= 50
a. What is the number of degrees of freedom that should be used for finding the critical value t,12?
df =O
(Type a whole number.)
b. Find the critical value t,/2 corresponding to a 95% confidence level.
ta/2 =
(Round to two decimal places as needed.)
c. Give a brief general description of the number of degrees of freedom.
O A. The number of degrees of freedom for a collection of sample data is the number of unique, non-repeated sample values.
O B. The number of degrees of freedom for a collection of sample data is the total number of sample values.
O C. The number of degrees of freedom for a collection of sample data is the number of sample values that are determined after certain restrictions have been imposed on all data values.
O D. The number of degrees of freedom for a collection of sample data is the number of sample values that can vary after certain restrictions have been imposed on all data values.
Expert Solution
This question has been solved!
Explore an expertly crafted, step-by-step solution for a thorough understanding of key concepts.

Step by step
Solved in 2 steps

Knowledge Booster


Learn more about
Need a deep-dive on the concept behind this application? Look no further. Learn more about this topic, statistics and related others by exploring similar questions and additional content below.Recommended textbooks for you
Glencoe Algebra 1, Student Edition, 9780079039897…
Algebra
ISBN:
9780079039897
Author:
Carter
Publisher:
McGraw Hill
Glencoe Algebra 1, Student Edition, 9780079039897…
Algebra
ISBN:
9780079039897
Author:
Carter
Publisher:
McGraw Hill