Construct a frequency distribution
Q: Find the mean, median, and mode for the scores in the following frequency distribution table:
A: given = data to find i)mean ii)median iii)mode
Q: interpret results. Further state the nature of the distribution of each variable in table No.06…
A: Given, A table of output of statistical suummary for distributions. To find, Further state the…
Q: Construct a frequency distribution, show relative frequencies, cumulative frequencies, draw a…
A: Frequency Distribution is constructed below: Class width formula: From the given information, the…
Q: Identify the class width, class midpoint and class boundaries for the following relative frequency…
A: The distance between successive classes of lower limits or upper limits is class width. The class…
Q: Construct a frequency distribution table of 4 classes for the collecting data and find the relative…
A: Frequency for an interval is equal to the number of observations that lie in that interval. For…
Q: The frequency of repair for the trucks owned by a trucking firm over a 5-year period has been…
A: Here in the given table we notice that first interval is 1.5-2.5 with a midpoint…
Q: A data set consists of 83 observations. How many classes would you recommend for a frequency…
A: Selection of number of classes:“2 to the k rule” suggests that the number of classes is the smallest…
Q: Construct a frequency distribution and a relative frequency histogram for the data set using five…
A: Obtain the frequency distribution table. The width of the class is determined below: From the…
Q: Based on this histogram, draw the ogive (the cumulative frequency polygon) for the Accu-Rating data.
A:
Q: Based on this histogram, draw the ogive (the cumulative relative frequency polygon) for the data.
A: By using the given histogram, the cumulative relative frequency is, Selling time Relative…
Q: construct a frequency distribution table for the following set of scores. include columns for…
A: The frequency is the number of times the data points has occurred in the data. The relative…
Q: 1. 1 1 323 24 4 22N 52 3 3. 3. 2. 3. 43 2
A: Given data
Q: Find the mean of the following sets of data.
A:
Q: A frequency distribution of the airborne speeds in miles per hour of planes is shown. Determine the…
A:
Q: What is the class width for a frequency distribution with 7 classes?
A:
Q: The frequency distribution representing the number of frequent flier miles accumulated by employees…
A: Here given grouped frequency distribution from which calculate cumulative frequency and calculate…
Q: Construct a frequency distribution for the following data. 13, 6, 10, 5, 11, 14, 2, 8, 15, 16, 9,…
A: Given 25 data values We have to construct a frequency distribution for the given data.
Q: Construct a Frequency Distribution Table
A: We want to construct Frequency distribution table
Q: Sketch a histogram of the frequency distribution shown below.
A: Since , the frequency distribution is given below , Class Limits Frequency 0-9 6 10--19 9…
Q: Construct a categorical frequency distribution for the data. Class Frequency Caramel Hazelnut Mocha…
A: It is given that C-caramel, H-Hazelnut, M-Mocha, P-plain and V-Vanilla.
Q: Classify the data and construct a frequency distribution by completing the following table: Class…
A:
Q: Draw a frequency histogram and provide a brief description of the distribution's shape
A: Introduction :- For given data we have to draw histogram and to give information about shape of the…
Q: Classify the following data: The type of palm trees on the island of Oahu. Nominal Ordinal…
A: Nominal: When the possible observations are tags or categories or names, without any natural…
Q: Find the median from the grouped frequency distribution table. Class Frequency (X) (f) 0-10 10 11-21…
A: The data given is as follows X Frequency 0-10 10 11 -21 30 22-31 43 32-41 83 42-51 190…
Q: Convert the following distribution of scores into a grouped frequency table and (i) And draw a…
A: It is asked to convert the distribution of scores into a grouped frequency table The following data…
Q: Construct a Grouped Frequency Distribution table and graph the distribution. Make comments on the…
A: The grouped frequency distribution table is given below: Class interval Frequency 10-29 12…
Q: . Construct a frequency distribution table. : A survey was taken on Andres Bonifacio Avenue. In…
A:
Q: Construct a frequency distribution and a relative frequency histogram for the data set using five…
A: class Frequency Relative frequency =class frequencyTotal…
Q: Find the mean for the scores in the following frequency distribution table
A: The frequency table with the corresponding frequencies is, Number Frequency Cumulative frequency…
Q: For the frequency distribution table below, find the median *
A: Median is the middle most value of arranged data. For frequency distribution the median is defined…
Q: Construct a frequency distribution for the data.
A: A sample of 25 inductees were given for determining the blood group. The categories are A, B, AB,…
Q: Construct a frequency distribution for the given data set using 6 classes. In the table, include the…
A:
Q: 手品的万好 价的2
A: Given : 45 56 61 60 63 55 32 44 60 70 53 65 57 54 42 51 80 56 83 45 67 40 62 47 63 45 60 67…
Q: Identify the histogram for the frequency distribution below. Data Frequency 2-6 3 7-11 12-16 6 17-21…
A: Draw Histogram Class Frequency 2 - 6 3 7 - 11 5 12 - 16 6 17 - 21 5 22 - 26 2
Q: The number of students in the tutoring center was recorded for 52 randomly selected times. The data…
A:
Q: Construct a frequency distribution and a frequency histogram for the data set. Describe the shape of…
A: Construct the frequency distribution for the energy consumption of natural gas. Consider that the…
Q: Construct a frequency distribution for the given data set using 6 classes. In the table, include the…
A:
Q: In a relative frequency distribution, what should the relative frequencies add up to? Select the…
A: Solution: 4. It is needed to explain about the relative frequencies.
Q: Construct a grouped frequency distribution, with percent frequencies. Copy the table to Microsoft…
A: Note: In case of multiple questions, as per the guidelines answer to first question will be…
Q: Construct a frequency distribution and a frequency histogram of the data using the indicated number…
A: The given data is Patients= 6 9 7 14 4 5 6 8 4 11 10 6 8 6 5 7 6 6 3 11
Q: Set up the following scores into a grouped frequency distribution. Obtain relative frequency and…
A:
Q: Based on the histogram, draw the ogive (the cumulative relative frequency polygon) for her data.
A: By using the histogram, the cumulative relative frequency is, Completion time Relative frequency…
Q: Complete the frequency distribution table.
A: Given, Σf = 48 => n = 48
Q: Construct a frequency distribution table for the following set of scores. Include columns for…
A: Frequency means, how many times a unit is repeated. If the number 2 is repeated 4 times, then we…
Q: 832, 4099, 3620, 2685, 3475, 1568, 3491, 3697, 4268, 3922, 2719, 4209, 3616, 4517, 4635, 3068,…
A: first enter the data into R to construct histogram use hist() function
Q: Construct a frequency distribution for the given data set using 6 classes. In the table, include the…
A: The class width is calculated as follows:
Q: For the following frequency distribution table,
A: Frequency distribution is a type of descriptive statistics.
Construct a frequency distribution for the data below:
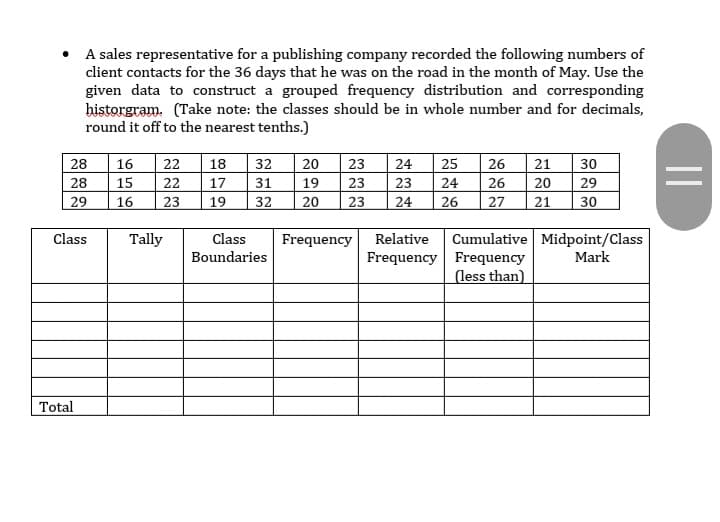
Step by step
Solved in 2 steps with 1 images